

Target Corp
TGTToday
+4.22%
5 Days
+9.56%
1 Month
+10.79%
6 Months
+9.64%
Year to Date
+18.21%
1 Year
-14.20%
TradingKey Stock Score of Target Corp
Currency: USD Updated: 2026-02-06Key Insights
Target Corp's fundamentals are relatively healthy, with an industry-leading ESG disclosure.and its growth potential is high.Its valuation is considered fairly valued, ranking 5 out of 27 in the Diversified Retail industry.Institutional ownership is very high.Over the past month, multiple analysts have rated it as Hold, with the highest price target at 102.01.In the medium term, the stock price is expected to trend up.The company has been performing well in the stock market over the past month, which is supported by its strong fundamentals and technicals.The stock price is trading sideways between the support and resistance levels, making it suitable for range-bound swing trading.
Target Corp's Score
Support & Resistance
Score Analysis
Media Coverage
Target Corp Highlights
Analyst Rating
Target Corp News
U.S. Consumers Downshift: Dollar Stores Boom While Big Retailers Falter, With Black Friday Showing Weakness
The creeping impact of tariff policies on households now highlights a stark "K-shaped divergence" in retail performance. Dollar stores are gaining traction, challenging traditional large-scale retailers' growth, and even record online Black Friday sales hint at a trend of consumer down-trading.

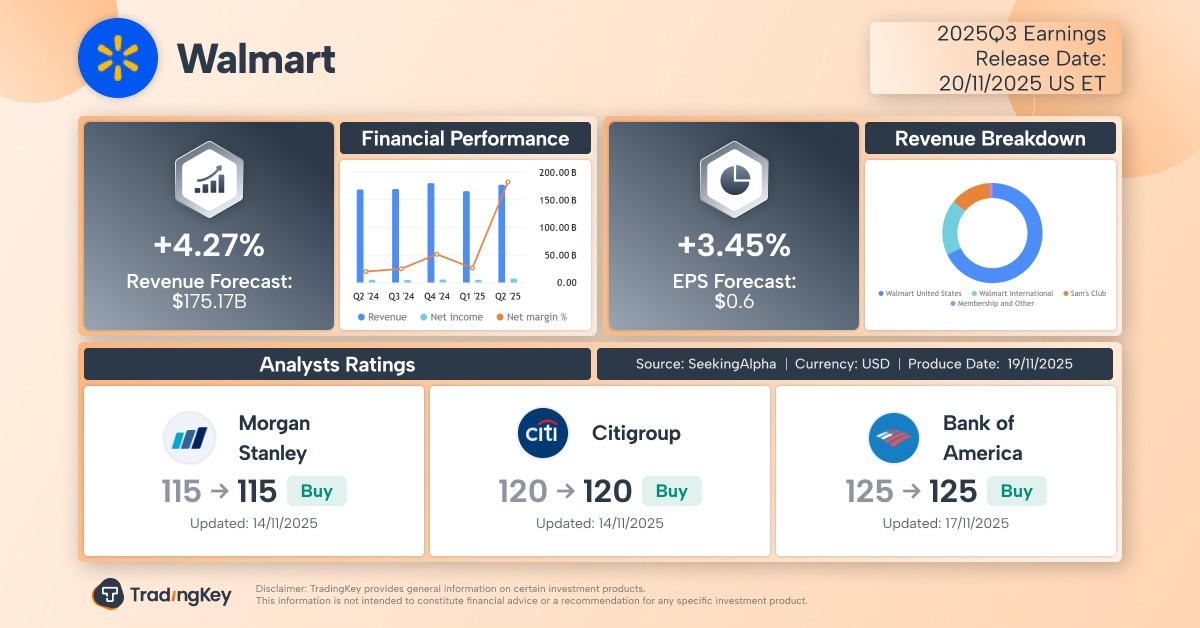
Walmart Q3 Earnings Highlights: Nasdaq Shift Signals AI Ambitions Amid E-commerce Boom
TradingKey - In stark contrast to US retailers like Target and Home Depot struggling amidst economic uncertainty, America’s largest retailer, Walmart (WMT), maintained robust growth in Q3 2025. Its fiscal year 2026 Q3 earnings report once again proved the company's resilience in a trade-down economy

Walmart Q3 Earnings Preview: The 'Defensive Buy' Amid Economic Headwinds and Market Turmoil
TradingKey - Walmart (WMT), the largest U.S. retailer, is scheduled to report its fiscal third-quarter 2026 earnings, for the period ending October, before the U.S. market opens on Thursday, November 20. Despite facing headwinds from tariff policies and weakening U.S. consumer vitality, Walmart has
Target Q3 Earnings Preview: Growth Recovery Expectations Remain Low. Is It Time to Buy?
TradingKey - U.S. retail giant Target (TGT) is grappling with shifting consumer habits and trade policy changes as it prepares to release its third-quarter 2025 earnings before the market open on Wednesday, November 19. The company, which primarily sells discretionary items, is striving to return to

Financial Indicators
EPS
Total revenue
Target Corp Info
Related Instruments
Popular Symbols
