

Lowe's Companies Inc
LOWToday
+1.20%
5 Days
+4.24%
1 Month
+12.65%
6 Months
+16.69%
Year to Date
+15.43%
1 Year
+10.49%
TradingKey Stock Score of Lowe's Companies Inc
Currency: USD Updated: 2026-02-06Key Insights
Lowe's Companies Inc's fundamentals are relatively stable, with an industry-leading ESG disclosure.and its growth potential is high.Its valuation is considered fairly valued, ranking 19 out of 93 in the Specialty Retailers industry.Institutional ownership is very high.Over the past month, multiple analysts have rated it as Buy, with the highest price target at 280.57.In the medium term, the stock price is expected to trend up.Despite an average stock market performance over the past month, the company shows strong fundamentals and technicals.The stock price is trading sideways between the support and resistance levels, making it suitable for range-bound swing trading.
Lowe's Companies Inc's Score
Support & Resistance
Score Analysis
Media Coverage
Lowe's Companies Inc Highlights
Analyst Rating
Lowe's Companies Inc News
2026 US Equity Strategy Shift: In-Depth Analysis of Real Estate Sector Driven by Valuation Troughs and "Policy Dividends"
Unveiling the most explosive sector in the 2026 US stock market: Real Estate. From Trump’s ban on institutional home purchases to the potential relaunch of the Fannie Mae and Freddie Mac IPOs, this article pierces through the policy fog to detail the underlying logic of tickers such as ITB and XHB.

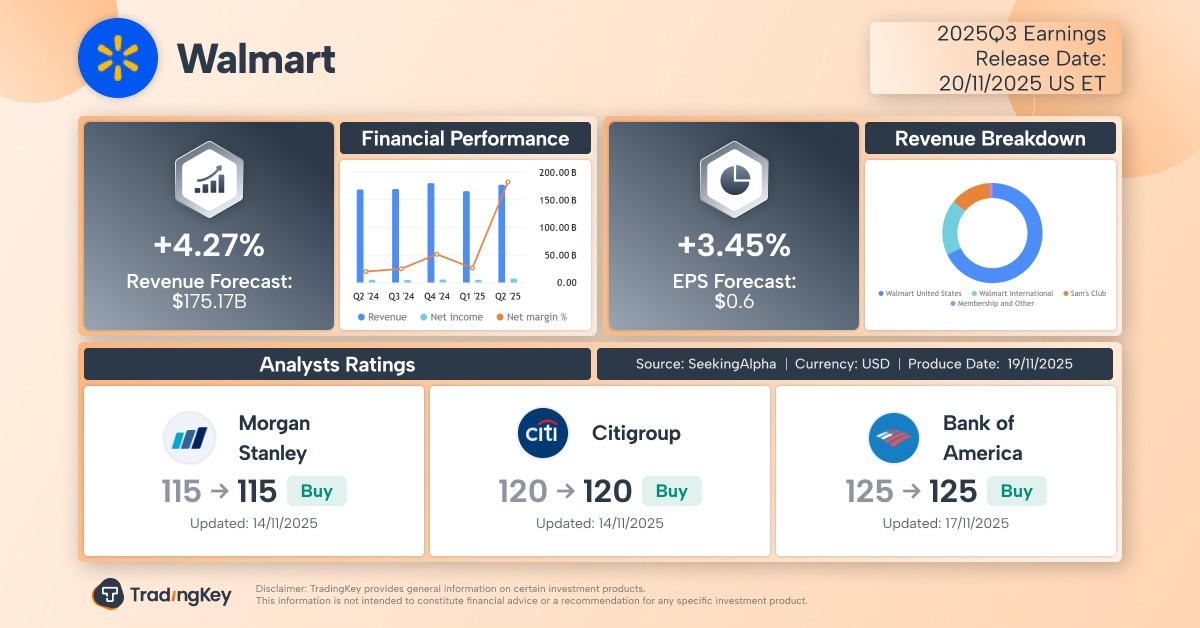
Walmart Q3 Earnings Preview: The 'Defensive Buy' Amid Economic Headwinds and Market Turmoil
TradingKey - Walmart (WMT), the largest U.S. retailer, is scheduled to report its fiscal third-quarter 2026 earnings, for the period ending October, before the U.S. market opens on Thursday, November 20. Despite facing headwinds from tariff policies and weakening U.S. consumer vitality, Walmart has
Financial Indicators
EPS
Total revenue
Lowe's Companies Inc Info
Related Instruments
Popular Symbols
