

NVIDIA Corp
NVDAToday
-1.10%
5 Days
-7.91%
1 Month
+8.61%
6 Months
+21.37%
Year to Date
+16.41%
1 Year
+64.72%
TradingKey Stock Score of NVIDIA Corp
Currency: USD Updated: 2026-05-21Key Insights
NVIDIA Corp's fundamentals are relatively very healthy, with an industry-leading ESG disclosure.and its growth potential is high.Its valuation is considered fairly valued, ranking 23 out of 106 in the Semiconductors & Semiconductor Equipment industry.Institutional ownership is very high.Over the past month, multiple analysts have rated it as Buy, with the highest price target at 271.62.In the medium term, the stock price is expected to trend up.The company has been performing well in the stock market over the past month, which is supported by its strong fundamentals and technicals.The stock price is trading sideways between the support and resistance levels, making it suitable for range-bound swing trading.
NVIDIA Corp's Score
Support & Resistance
Score Analysis
Media Coverage
NVIDIA Corp Highlights
NVIDIA Corporation, an American multinational technology firm, is headquartered in Santa Clara, California, and incorporated in Delaware. Established in 1993 by Jensen Huang, Chris Malachowsky, and Curtis Priem, the company designs graphics processing units, data science APIs for high-performance computing, and system on a chip units for automotive and mobile markets. As a premier supplier of artificial intelligence solutions, NVIDIA designs hardware that is manufactured through outsourcing partnerships.
The company's professional GPU series powers edge-to-cloud computing systems, supercomputers, and workstations across architecture, engineering, media, automotive, scientific research, and manufacturing sectors. Its GeForce GPU line serves consumer applications including PC gaming, 3D rendering, and video production, commanding 65% of global discrete desktop GPU sales in Q4 2024. NVIDIA's gaming ecosystem includes Shield Portable handhelds, Shield Tablets, Shield TV media players, and the GeForce Now cloud gaming platform.
Beyond hardware, NVIDIA develops the CUDA parallel computing platform enabling GPU-accelerated programs deployed in global supercomputing facilities. Since the late 2000s, its Tegra processors have powered mobile devices and automotive infotainment systems. Key competitors span AMD, Intel, Qualcomm, and AI specialists like Cerebras and Graphcore, while its Maxine software suite delivers AI-enhanced audio/video processing.
Analyst Rating
NVIDIA Corp News
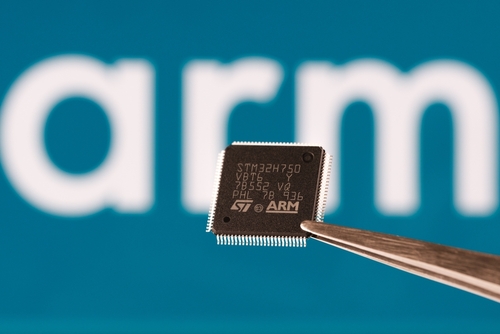
Arm Market Value Surpasses $300 Billion, SoftBank’s 87% Stake Makes It the Biggest Winner, How Arm Drives Wall Street Wild With CPUs?
TradingKey - Driven by the strong catalyst of a sustained explosion in global demand for AI computing power, chip architecture giant Arm (ARM) has reached a historic milestone. This has yielded the most stellar returns of their investment careers for Arm’s majority shareholder, SoftBank Group, and its founder, Masayoshi Son.
Today’s Market Recap: Quantum Stocks Soar, Trump Issues Iran Warning, and S&P Edges Up
U.S. markets edged higher alongside a massive quantum computing rally, while investors navigated rising stagflation risks, geopolitical tensions regarding Iran, and controversy surrounding the SpaceX IPO.

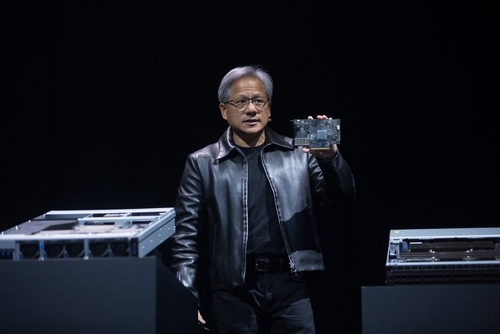
Nvidia Beat Q1 FY2027 by $2.6 Billion and Grew 85% — Why Is the Reaction Mixed and Is NVDA a Buy Now?
TradingKey - Nvidia Q1 FY2027: $81.62B revenue vs $79B est, $1.87 EPS vs $1.78, Data Centre $70B+, 78%+ margins. Guidance only modestly above consensus. NVDA at $223, Fib 0.382 support. Buy the reaction?
Nvidia Stock Price Forecast: Will NVDA Reach a New High in 2026? What About the Next 5 Years?
This comprehensive analysis forecasts Nvidia's stock reaching $300 by 2026 and potentially multiplying fivefold in five years, driven by its transformation into a full-stack AI platform.
Exceeding Expectations Not Enough? Why Nvidia Shares Still Cannot Escape the Post-Earnings Pullback Curse?
TradingKey - Despite Q1 earnings released after the market close on May 21 significantly beating expectations—with revenue of $81.6 billion and data center revenue of $75.2 billion both well above Wall Street consensus—and the company announcing an $80 billion share buyback program alongside a dividend hike, the after-hours share price fell 1.26%, continuing the anomalous trend of "strong earnings followed by a correction."
Nvidia Earnings Ignite Asian Stock Markets. South Korea’s Kospi Index Surges Over 8%, OpenAI IPO Plan Adds to AI Frenzy
Tradingkey - On May 21, NVIDIA's stellar earnings results were released as expected, while OpenAI's plan to file for an IPO in the coming weeks further ignited market enthusiasm for the AI sector, driving a broad recovery in Asia-Pacific equity markets. Core NVIDIA supply chain plays, including Samsung Electronics, SK Hynix, TSMC, and Advantest, rose in response and strengthened across the board. Geopolitical tensions also showed signs of easing; according to AXIOS, the U.S. and Iran plan to initiate 30-day negotiations. U.S. sources stated that Trump told Netanyahu that mediators are drafting a "Letter of Intent" to be signed by the U.S. and Iran to formally end the conflict and launch a 30-day negotiation period regarding Iran’s nuclear program, the opening of the Strait of Hormuz, and other issues.

Financial Indicators
EPS
Total revenue
NVIDIA Corp Info
NVIDIA Corporation, an American multinational technology firm, is headquartered in Santa Clara, California, and incorporated in Delaware. Established in 1993 by Jensen Huang, Chris Malachowsky, and Curtis Priem, the company designs graphics processing units, data science APIs for high-performance computing, and system on a chip units for automotive and mobile markets. As a premier supplier of artificial intelligence solutions, NVIDIA designs hardware that is manufactured through outsourcing partnerships.
The company's professional GPU series powers edge-to-cloud computing systems, supercomputers, and workstations across architecture, engineering, media, automotive, scientific research, and manufacturing sectors. Its GeForce GPU line serves consumer applications including PC gaming, 3D rendering, and video production, commanding 65% of global discrete desktop GPU sales in Q4 2024. NVIDIA's gaming ecosystem includes Shield Portable handhelds, Shield Tablets, Shield TV media players, and the GeForce Now cloud gaming platform.
Beyond hardware, NVIDIA develops the CUDA parallel computing platform enabling GPU-accelerated programs deployed in global supercomputing facilities. Since the late 2000s, its Tegra processors have powered mobile devices and automotive infotainment systems. Key competitors span AMD, Intel, Qualcomm, and AI specialists like Cerebras and Graphcore, while its Maxine software suite delivers AI-enhanced audio/video processing.
Related Instruments
Popular Instruments
