

Amazon.com Inc
AMZNToday
+1.10%
5 Days
-0.54%
1 Month
+0.27%
6 Months
-4.56%
Year to Date
-8.77%
1 Year
+9.57%
TradingKey Stock Score of Amazon.com Inc
Currency: USD Updated: 2026-04-01Key Insights
Amazon.com Inc's fundamentals are relatively healthy, with an industry-leading ESG disclosure.and its growth potential is high.Its valuation is considered fairly valued, ranking 10 out of 27 in the Diversified Retail industry.Institutional ownership is very high.Over the past month, multiple analysts have rated it as Buy, with the highest price target at 279.52.In the medium term, the stock price is expected to remain stable.Despite an average stock market performance over the past month, the company shows strong fundamentals and technicals.The stock price is trading sideways between the support and resistance levels, making it suitable for range-bound swing trading.
Amazon.com Inc's Score
Support & Resistance
Score Analysis
Media Coverage
Amazon.com Inc Highlights
Operating as Amazon, Amazon.com, Inc. stands as an American multinational tech firm specializing in e-commerce, cloud computing, online advertising, digital streaming, and artificial intelligence. Founded in 1994 by Jeff Bezos in Bellevue, Washington, the company initially launched as an online bookstore but progressively expanded its offerings to include diverse product categories, earning the moniker "The Everything Store". Today, Amazon is recognized as one of the Big Five U.S. technology giants, alongside Alphabet, Apple, Meta, and Microsoft.
The company manages numerous subsidiaries, including Amazon Web Services (AWS) for cloud computing, Zoox (self-driving vehicle division), Kuiper Systems (satellite internet provider), and Amazon Lab126 (computer hardware R&D). Other key subsidiaries include Ring, Twitch, IMDb, and Whole Foods Market, whose 2017 acquisition for US$13.4 billion significantly bolstered Amazon’s physical retail presence. The company distributes downloadable and streaming content via Amazon Prime Video, MGM+, Amazon Music, Twitch, Audible, and Wondery. Through Amazon Publishing, it publishes books; Amazon MGM Studios (including the 2022-acquired Metro-Goldwyn-Mayer) produces/distributes film/TV content; Brilliance Audio and Audible specialize in audiobook production/distribution. Amazon also manufactures consumer electronics, notably Kindle e-readers, Echo devices, Fire tablets, and Fire TVs.
Renowned for disrupting industries through technological innovation and aggressive profit reinvestment in capital expenditures, Amazon is, as of 2023, the world’s largest online retailer, marketplace, smart speaker provider, AWS cloud service, Twitch live-streaming platform, and revenue/market share-leading internet company. In 2021, it overtook Walmart as the top global retailer outside China, propelled by its Amazon Prime subscription service (200 million worldwide subscribers).
As of 2024, it ranks as the second-largest private employer in the U.S., the second-largest global and U.S. firm by revenue, the 12th-most visited website globally (84% U.S. traffic), and the global R&D leader (US$73 billion spent in 2022). Criticisms of Amazon include surveillance partnerships, poor labor conditions, anti-union efforts, environmental impact, anti-competitive practices, censorship issues, and exploitative treatment of small businesses/suppliers.
Analyst Rating
Amazon.com Inc News
SpaceX Reported to File for IPO—Here Is Another Reason to Buy Amazon Stock
TradingKey - According to a report on Reuters, SpaceX has confidentially submitted an IPO to be the largest since the original record of $25 billion. SpaceX IPO would create another publicly traded company that focuses solely on providing customers with high-speed internet through the use of satelli
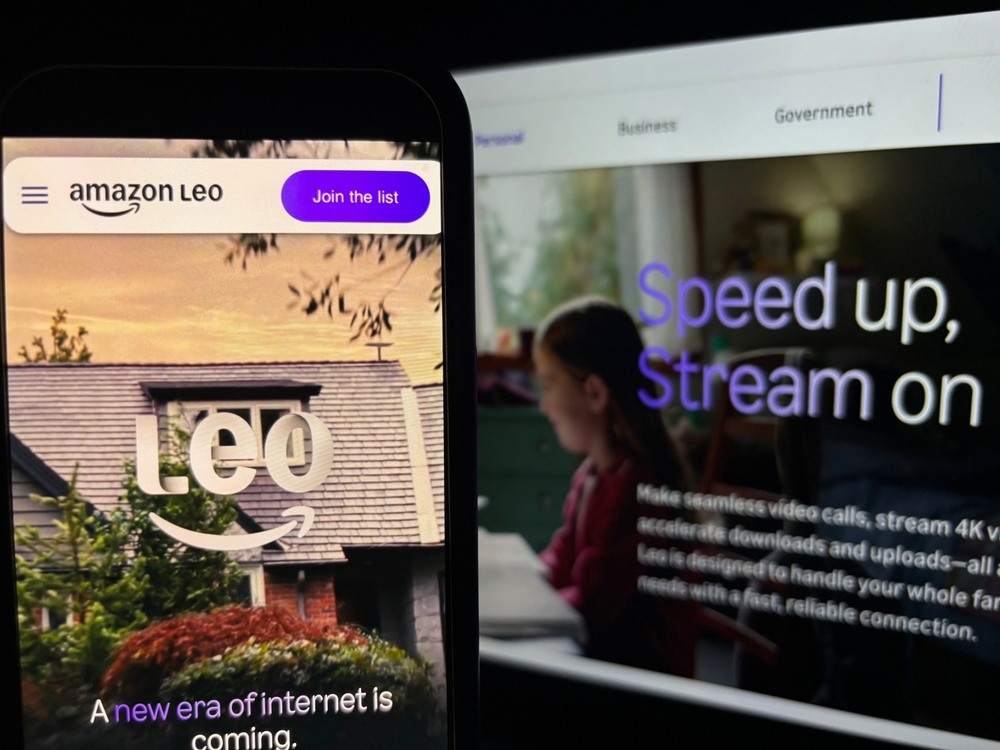
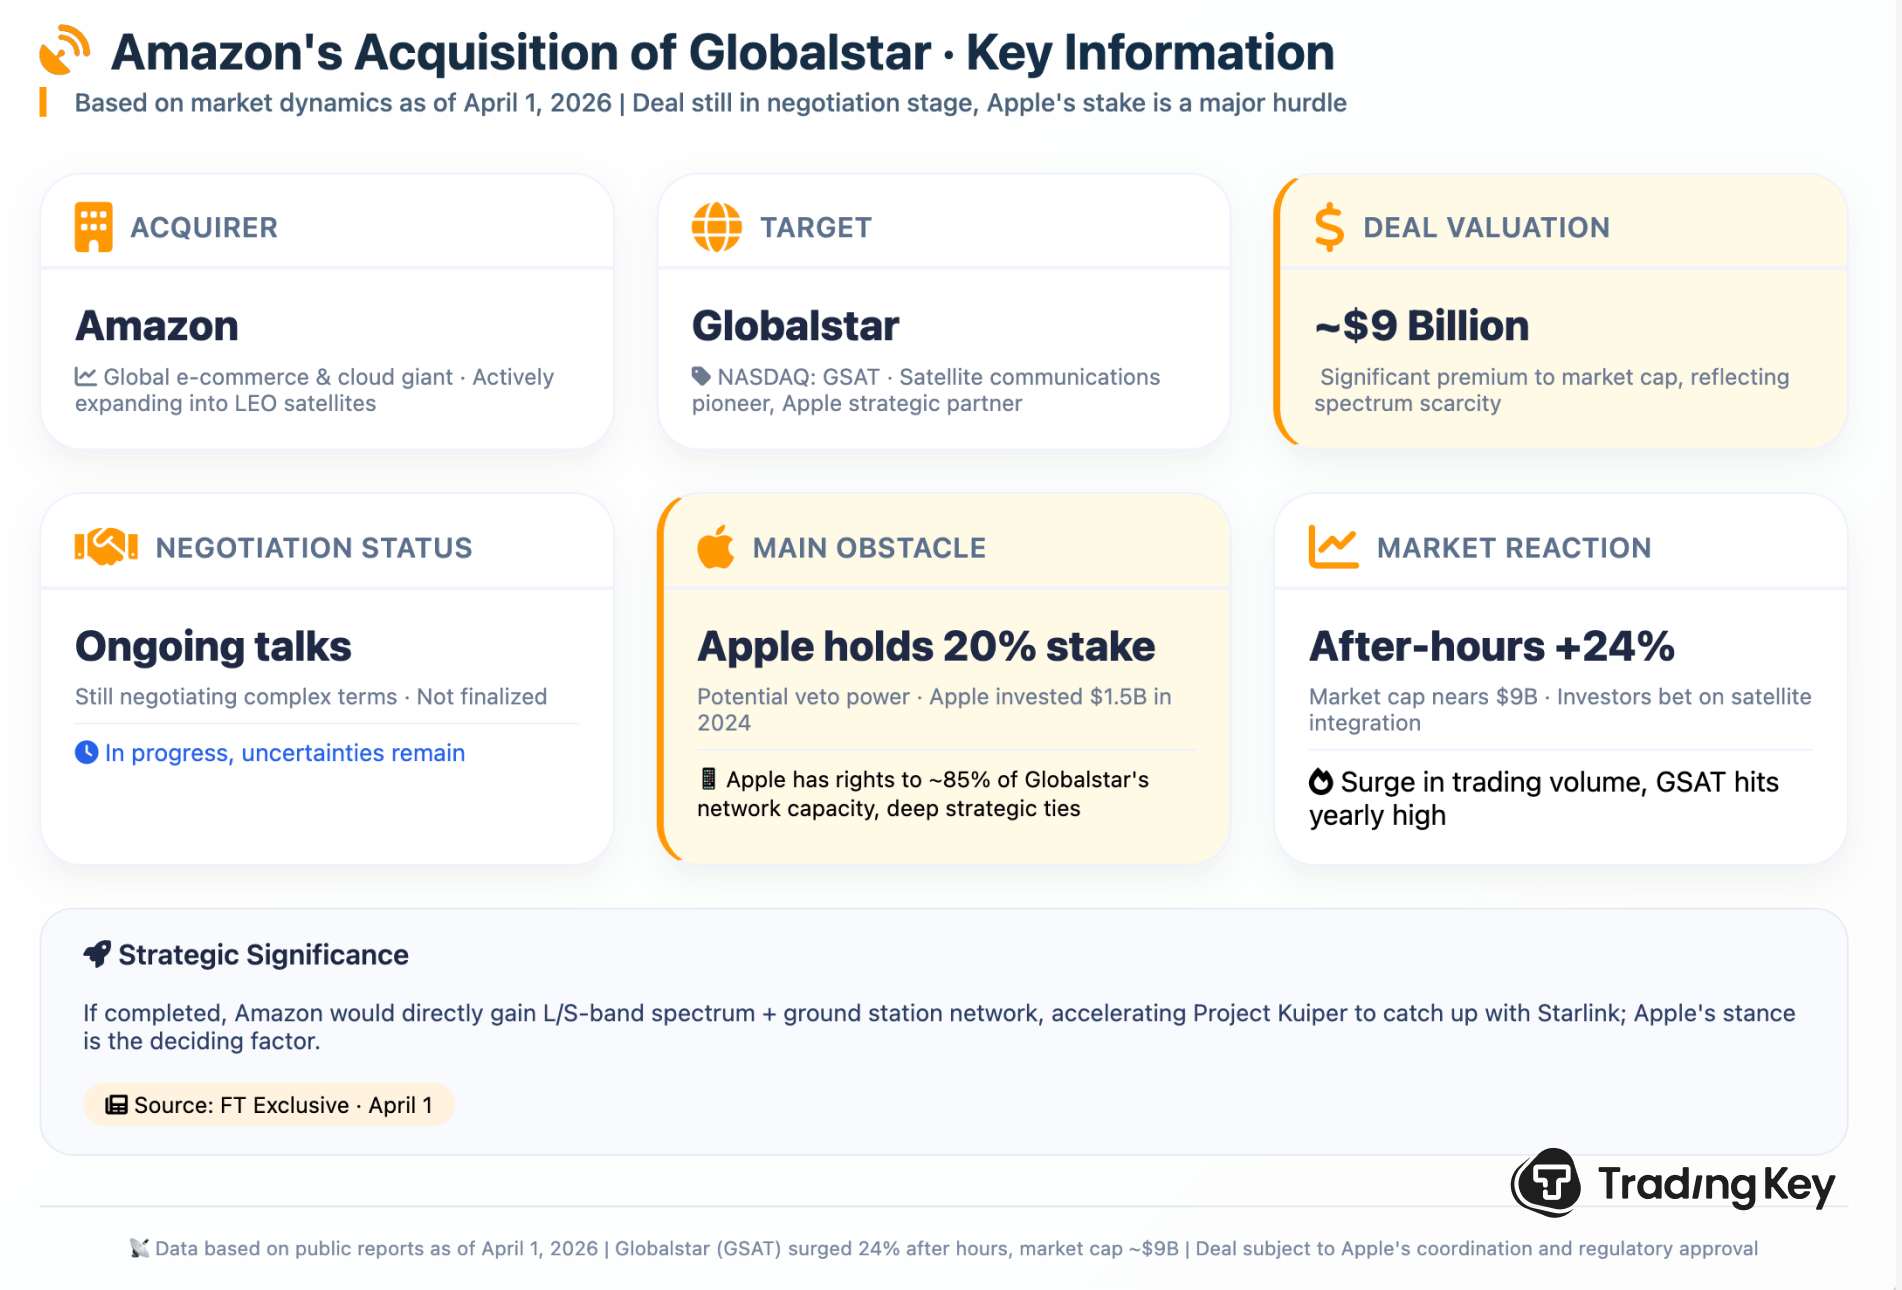
Amazon Talks to Acquire Globalstar: Can $9 Billion Deal Challenge SpaceX Starlink?
TradingKey - During after-hours trading on April 1, 2026, shares of satellite communications company Globalstar (GSAT) surged 24%, with its market capitalization briefly approaching $9 billion. The rally was triggered by an exclusive report from the Financial Times stating that e-commerce giant Amaz
OpenAI Completes $122 Billion Funding, How Far Is $852 Billion-Valued OpenAI From IPO?
TradingKey - On Tuesday, March 31, OpenAI officially announced the completion of its largest private funding round since its inception. The deal set a new global record for private financing, bringing the company's post-money valuation to $852 billion.

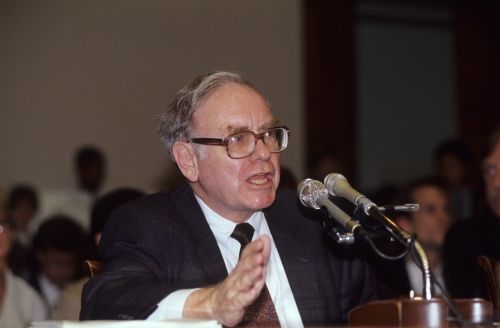
Warren Buffett Selling Stocks and Buying in His Last Quarter as Berkshire Hathaway CEO: Should You Follow Him?
TradingKey - Warren Buffett just stepped down from the CEO position at Berkshire Hathaway (BRKB)in 2025 Q4, and he left a $400 billion trail of crumbs behind him. His last-quarter transactions were anything but predictable: a colossal 77% sale of Amazon stock (AMZN); a tactical withdrawal from Apple
Meta Single-Day Market Value Evaporated $119 Billion, What Happened?
TradingKey - Social media giant Meta Platforms (META) suffered its sharpest sell-off of the year on Thursday, as shares plunged 8%, wiping out $119 billion in market value in a single day. The direct catalyst for the slump was a series of recent legal setbacks in New Mexico and California.

Divergence Between Institutional Exit and Retail Frenzy: Dissecting the Earnings Truth Behind the ‘Magnificent Seven’ Split
An in-depth analysis of the extreme divergence between institutional exodus and retail frenzy in the 2026 US stock market, uncovering the truth behind AI profitability and ROI amid the slump of the "Magnificent Seven." This article deconstructs how capital is rotating from overvalued tech stocks into "HALO assets" such as energy and industrials, providing investors with a practical defensive guide to navigate structural rebalancing.
Financial Indicators
EPS
Total revenue
Amazon.com Inc Info
Operating as Amazon, Amazon.com, Inc. stands as an American multinational tech firm specializing in e-commerce, cloud computing, online advertising, digital streaming, and artificial intelligence. Founded in 1994 by Jeff Bezos in Bellevue, Washington, the company initially launched as an online bookstore but progressively expanded its offerings to include diverse product categories, earning the moniker "The Everything Store". Today, Amazon is recognized as one of the Big Five U.S. technology giants, alongside Alphabet, Apple, Meta, and Microsoft.
The company manages numerous subsidiaries, including Amazon Web Services (AWS) for cloud computing, Zoox (self-driving vehicle division), Kuiper Systems (satellite internet provider), and Amazon Lab126 (computer hardware R&D). Other key subsidiaries include Ring, Twitch, IMDb, and Whole Foods Market, whose 2017 acquisition for US$13.4 billion significantly bolstered Amazon’s physical retail presence. The company distributes downloadable and streaming content via Amazon Prime Video, MGM+, Amazon Music, Twitch, Audible, and Wondery. Through Amazon Publishing, it publishes books; Amazon MGM Studios (including the 2022-acquired Metro-Goldwyn-Mayer) produces/distributes film/TV content; Brilliance Audio and Audible specialize in audiobook production/distribution. Amazon also manufactures consumer electronics, notably Kindle e-readers, Echo devices, Fire tablets, and Fire TVs.
Renowned for disrupting industries through technological innovation and aggressive profit reinvestment in capital expenditures, Amazon is, as of 2023, the world’s largest online retailer, marketplace, smart speaker provider, AWS cloud service, Twitch live-streaming platform, and revenue/market share-leading internet company. In 2021, it overtook Walmart as the top global retailer outside China, propelled by its Amazon Prime subscription service (200 million worldwide subscribers).
As of 2024, it ranks as the second-largest private employer in the U.S., the second-largest global and U.S. firm by revenue, the 12th-most visited website globally (84% U.S. traffic), and the global R&D leader (US$73 billion spent in 2022). Criticisms of Amazon include surveillance partnerships, poor labor conditions, anti-union efforts, environmental impact, anti-competitive practices, censorship issues, and exploitative treatment of small businesses/suppliers.
Related Instruments
Popular Symbols
