tradingkey.logo
XAUUSD

Gold

XAUUSD
Market is Closed
View Detailed Chart

3210.67USD

-26.43-0.81%
Time
1m
15m
30m
1h
4h
D
W
Please select

Today

-0.81%

5 Days

+7.03%

1 Month

+7.51%

6 Months

+21.24%

Year to Date

+22.30%

1 Year

+35.95%

View Detailed Chart

Key Data Points

Opening Price

3219.57

Previous Closing Price

3237.1
Price Range of the Day
3193.553245.52
52-Week Price Range
0.003210.67

Indicators

The Indicators feature provides value and direction analysis for various instruments under a selection of technical indicators, together with a technical summary.

This feature includes nine of the commonly used technical indicators: MACD, RSI, KDJ, StochRSI, ATR, CCI, WR, TRIX and MA. You may also adjust the timeframe depending on your needs.

Please note that technical analysis is only part of investment reference, and there is no absolute standard for using numerical values to assess direction. The results are for reference only, and we are not responsible for the accuracy of the indicator calculations and summaries.

1m
5m
15m
30m
1h
2h
4h
D
W
M
1m
5m
15m
D
Buy
Sell(1)
Neutral(1)
Buy(9)
Indicators
Sell(1)
Neutral(1)
Buy(3)
Indicators
Value
Direction
MACD(12,26,9)
20.298
Buy
RSI(14)
67.400
Neutral
STOCH(KDJ)(9,3,3)
85.762
Buy
ATR(14)
69.268
High Vlolatility
CCI(14)
144.838
Buy
Williams %R
12.050
Overbought
TRIX(12,20)
0.227
Sell
StochRSI(14)
84.832
Overbought
Moving Average
Sell(0)
Neutral(0)
Buy(6)
Indicators
Value
Direction
MA5
3137.538
Buy
MA10
3107.099
Buy
MA20
3076.801
Buy
MA50
2977.953
Buy
MA100
2826.488
Buy
MA200
2691.907
Buy

Gold Trading Strategy

Intraday
Medium Term
Short Term
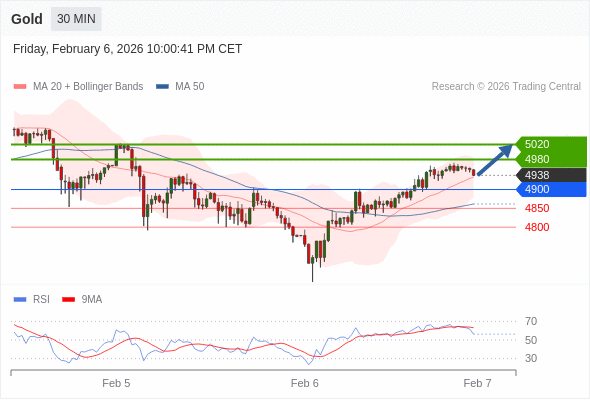
Long positions above 3190.00 with targets at 3245.00 & 3285.00 in extension.

Trading Strategy

Long positions above 3190.00 with targets at 3245.00 & 3285.00 in extension.

Alternative scenario

below 3190.00 look for further downside with 3155.00 & 3130.00 as targets.

Comment

long positions above 3190.00 with targets at 3245.00 & 3285.00 in extension.

29 minutes ago
Source: Trading Central(Reference Only)

Gold News

Gold price declines toward $3,200 as markets assess trade war headlines

Gold price started the week with a small bearish gap but managed to regain its traction during the Asian trading hours. After touching a new record-high of $3,245, XAU/USD entered a consolidation phase and declined toward $3,200.

Fxstreet8 hours ago
Gold price started the week with a small bearish gap but managed to regain its traction during the Asian trading hours. After touching a new record-high of $3,245, XAU/USD entered a consolidation phase and declined toward $3,200.

[Reuters Analysis] Gold is an uncertain certainty amid Trump tariff turmoil: Russell

LAUNCESTON, Australia, April 14 (Reuters) - As U.S. President Donald Trump ratcheted up his tariff war on the world, gold kept climbing in lockstep to reach a succession of record highs.The precious metal reached a fresh peak of $3,245.28 an ounce on April 11 and has climbed 28% ...

Reuters9 hours ago
LAUNCESTON, Australia, April 14 (Reuters) - As U.S. President Donald Trump ratcheted up his tariff war on the world, gold kept climbing in lockstep to reach a succession of record highs.The precious metal reached a fresh peak of $3,245.28 an ounce on April 11 and has climbed 28% ...

Gold rebounds sharply after early april dip – Société Générale

Gold staged a strong V-shaped recovery after an early April pullback, holding key support near $3135. Despite overbought signals, momentum remains intact, with eyes now on the next upside targets at $3290 and $3345/3370, Société Générale's FX analysts note.

Fxstreet10 hours ago
Gold staged a strong V-shaped recovery after an early April pullback, holding key support near $3135. Despite overbought signals, momentum remains intact, with eyes now on the next upside targets at $3290 and $3345/3370, Société Générale's FX analysts note.

The Fed’s Balancing Act: Why Rate Cuts May Be Off the Table Despite Easing CPI

TradingKey - The March CPI report brought what looked like a victory: headline inflation cooled to 2.4% annual, and core CPI, which omits food and fuel, dropped to 2.8%, its lowest since this time last year.

TradingKey10 hours ago
TradingKey - The March CPI report brought what looked like a victory: headline inflation cooled to 2.4% annual, and core CPI, which omits food and fuel, dropped to 2.8%, its lowest since this time last year.

Chinese Gold ETFs see record inflows – ING

Recent reports suggest that Chinese gold exchange-traded funds (ETF) inflows reached a fresh daily record late last week. Investors continue to rush towards the yellow metal amid intensifying trade tensions.

Fxstreet11 hours ago
Recent reports suggest that Chinese gold exchange-traded funds (ETF) inflows reached a fresh daily record late last week. Investors continue to rush towards the yellow metal amid intensifying trade tensions.

Gold Miners Shine: M&A and Safe-Haven Demand Fuel Rally

TradingKey - Gold stocks emerged as a bright spot in last Friday’s market session. Barrick Gold (GOLD ) saw its share price rise 7.02%, Newmont Corporation climbed 7.91%, and Coeur Mining (CDE) soared with a 7.83% gain. 

TradingKey11 hours ago
TradingKey - Gold stocks emerged as a bright spot in last Friday’s market session. Barrick Gold (GOLD ) saw its share price rise 7.02%, Newmont Corporation climbed 7.91%, and Coeur Mining (CDE) soared with a 7.83% gain. 

More Details of Gold

Gold is a precious metal that has been valued by human civilizations for thousands of years. It is widely used for jewelry, art, and coinage, as well as for industrial and medical purposes. Gold is also a popular financial asset that investors buy and sell to hedge against inflation, currency fluctuations, and market risks. One of the main features of gold as an investment is its scarcity and durability. It is highly malleable, ductile, and resistant to corrosion and tarnishing, making it a long-lasting and reliable asset. It has a distinctive yellow color and a high luster. It is also a good conductor of electricity and heat. Gold can be alloyed with other metals to create different colors and hardness. The purity of gold is measured in karats, with 24 karats being pure gold. Gold is believed to have formed in the cores of massive stars that exploded as supernovae, scattering gold and other heavy elements into space. Some of these elements were incorporated into the Earth when it formed about 4.5 billion years ago. Most of the gold on Earth sank to the core during the planet's formation, but some remained in the crust and mantle, where it can be mined today. According to the World Gold Council, the total amount of gold mined in human history is about 200,000 metric tons, which would fit into a cube with sides of 21 meters. In the economic market, gold has high liquidity, so anywhere in the world, gold is always used for simple, easy buying and selling transactions without worrying about the original value being lost. The development of technology makes buying and selling more convenient and faster than ever. The global market value of gold is determined by the supply and demand of the metal, as well as by the expectations and sentiments of market participants. The main gold trading hubs are London, New York, and Shanghai, where gold is traded over-the-counter (OTC) or on futures and options exchanges. Other gold markets include Tokyo, Zurich, Dubai, Hong Kong, Singapore, and Mumbai. The global gold market operates 24 hours a day, seven days a week. Gold has various applications in different industries and sectors. Besides jewelry, which accounts for about half of the global gold demand, gold is also used for electronics, dentistry, medicine, aerospace, and glassmaking. Gold is also a key component of many religious and cultural artifacts, as well as a symbol of status and wealth. Gold is also used for gilding and gold leaf, which are thin sheets of gold applied to various surfaces for decoration. Gold is an attractive investment option for many reasons. Gold is considered a safe-haven asset that can preserve its value, as well as a hedge against inflation and currency devaluation, as it tends to perform well during periods of economic and political uncertainty and crisis. Gold is also a diversifier that can reduce the overall risk and volatility of a portfolio, as it has a low or negative correlation with other asset classes, such as stocks and bonds. Gold is also a liquid and accessible asset that can be bought and sold easily through various channels, such as bullion, coins, ETFs, CFDs, futures, and options. As an investment option, gold offers many benefits and opportunities for investors of all types and levels.
What is the historical return of gold?up
The historical return of gold has varied over time, with long-term average annual returns typically ranging between 1% to 10%. Gold is often considered a hedge against inflation and economic uncertainty, leading to periods of significant price appreciation during times of market volatility or geopolitical instability.
What are the best hours to trade gold?up
The best hours to trade gold are typically during the overlapping trading hours of major financial centers, such as London, New York, and Tokyo. This period, known as the "golden hours," often occurs during the European and U.S. market overlaps, which are between 8:00 am and 5:00 pm GMT. During these hours, there is typically higher liquidity, increased trading volume, and more price movement in the gold market, providing more opportunities for traders.
What was the highest price of gold ever?up
The highest price of gold ever recorded was $2,135 on Dec. 4, 2023, which was driven by expectations of a Fed rate cut, economic and political uncertainty, and conflicts in the Middle East and Ukraine.

Related Instruments

Gold

3210.67

-26.43-0.81%
tradingkey.logo
tradingkey.logo
Intraday Data provided by Refinitiv and subject to terms of use. Historical and current end-of-day data provided by Refinitiv. All quotes are in local exchange time. Real-time last sale data for U.S. stock quotes reflect trades reported through Nasdaq only. Intraday data delayed at least 15 minutes or per exchange requirements.
* References, analysis, and trading strategies are provided by the third-party provider, Trading Central, and the point of view is based on the independent assessment and judgement of the analyst, without considering the investment objectives and financial situation of the investors.
Risk Warning: Our Website and Mobile App provides only general information on certain investment products. Finsights does not provide, and the provision of such information must not be construed as Finsights providing, financial advice or recommendation for any investment product.
Investment products are subject to significant investment risks, including the possible loss of the principal amount invested and may not be suitable for everyone. Past performance of investment products is not indicative of their future performance.
Finsights may allow third party advertisers or affiliates to place or deliver advertisements on our Website or Mobile App or any part thereof and may be compensated by them based on your interaction with the advertisements.
© Copyright: FINSIGHTS MEDIA PTE. LTD. All Rights Reserved.