

Costco Wholesale Corp
COSTToday
+1.20%
5 Days
+6.48%
1 Month
+13.44%
6 Months
+2.43%
Year to Date
+16.10%
1 Year
-4.09%
TradingKey Stock Score of Costco Wholesale Corp
Currency: USD Updated: 2026-02-06Key Insights
Costco Wholesale Corp's fundamentals are relatively healthy, with an industry-leading ESG disclosure.and its growth potential is high.Its valuation is considered fairly valued, ranking 4 out of 27 in the Diversified Retail industry.Institutional ownership is very high.Over the past month, multiple analysts have rated it as Buy, with the highest price target at 1041.85.In the medium term, the stock price is expected to remain stable.The company has been performing well in the stock market over the past month, which is supported by its strong fundamentals and technicals.The stock price is trading sideways between the support and resistance levels, making it suitable for range-bound swing trading.
Costco Wholesale Corp's Score
Support & Resistance
Score Analysis
Media Coverage
Costco Wholesale Corp Highlights
Costco Wholesale Corporation, commonly referred to as Costco, is an American multinational company that manages a network of membership-only big-box warehouse club retail stores. As of 2021, Costco is the third-largest retailer globally, and by August 2024, it has established itself as the largest retailer of beef, poultry, organic produce, and wine, with nearly one-third of American consumers shopping regularly at its warehouses. Costco holds the #11 position on the Fortune 500 list of the largest corporations in the United States by total revenue. Initially, Costco operated with a wholesale business model focused on signing up businesses as members, later expanding to include individual consumers and selling products aimed at them, including its private label brand.
Costco is headquartered in Issaquah, Washington, an eastern suburb of Seattle, although its Kirkland Signature house label reflects its previous location in Kirkland. The company's first warehouse opened in Seattle in 1983. Through a series of mergers, Costco's corporate lineage can be traced back to 1976 when it was established as a competitor to Price Club, which began in San Diego, California. As of May 2025, Costco operates 905 warehouses worldwide, with 86% situated in North America.
Analyst Rating
Costco Wholesale Corp News
What Are Costco’s Stock Prospects Today into 2026?
TradingKey - Despite a rare year of underperformance (2019), Costco Wholesale (COST) has always been one of the most closely followed consumer retail stocks.
Not a “Multimillionaire Maker,” But Is Costco (COST) a Buy in 2026?
But at today's valuation, can Costco still be counted among the millionaire-making machines?
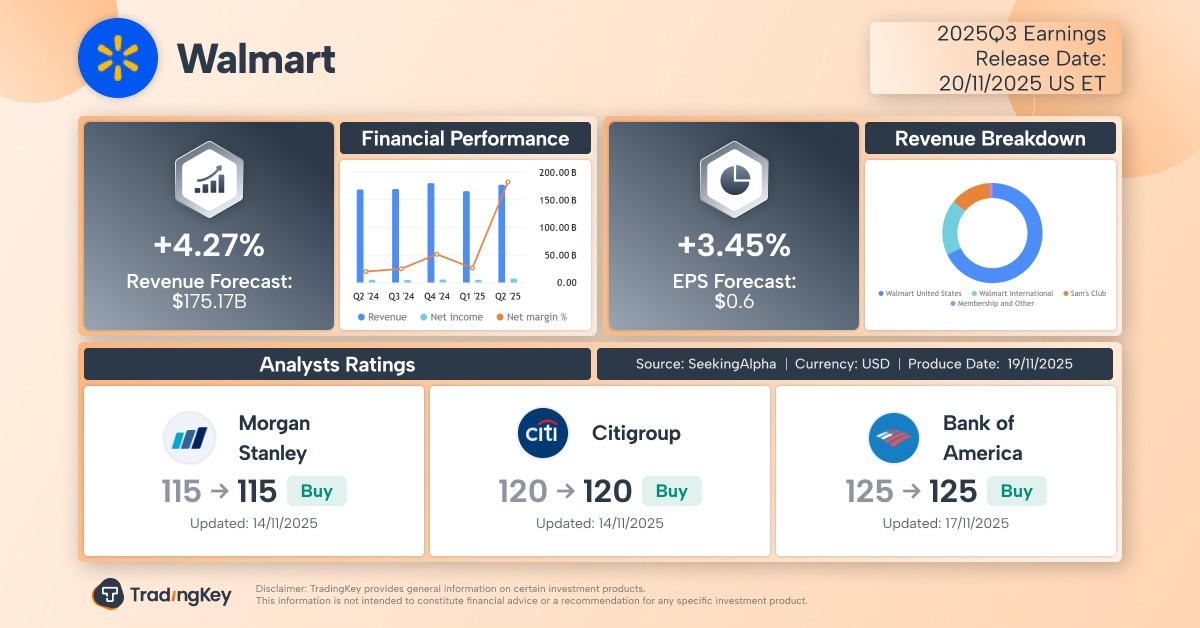
Walmart Q3 Earnings Preview: The 'Defensive Buy' Amid Economic Headwinds and Market Turmoil
TradingKey - Walmart (WMT), the largest U.S. retailer, is scheduled to report its fiscal third-quarter 2026 earnings, for the period ending October, before the U.S. market opens on Thursday, November 20. Despite facing headwinds from tariff policies and weakening U.S. consumer vitality, Walmart has
Target Q3 Earnings Preview: Growth Recovery Expectations Remain Low. Is It Time to Buy?
TradingKey - U.S. retail giant Target (TGT) is grappling with shifting consumer habits and trade policy changes as it prepares to release its third-quarter 2025 earnings before the market open on Wednesday, November 19. The company, which primarily sells discretionary items, is striving to return to
Costco Closes 2025 with a Bang: Membership Loyalty Drives Profit Surge
TradingKey - In a complex macroeconomic environment, Costco delivered robust revenue growth, improved profit margins, and exceeded earnings per share expectations, concluding its 2025 fiscal year on a high note. The company’s membership-driven business model demonstrated enduring resilience.
[IN-DEPTH ANALYSIS] Costco: Balancing Stability with Growth Opportunity
Costco has built a competitive moat through its unique membership-based warehouse business model, featuring low prices, high volumes, and a synergy between private-label and curated products. Its solid fundamentals, including high renewal rates, consistent comparable sales growth, nearly $15 billion
Financial Indicators
EPS
Total revenue
Costco Wholesale Corp Info
Costco Wholesale Corporation, commonly referred to as Costco, is an American multinational company that manages a network of membership-only big-box warehouse club retail stores. As of 2021, Costco is the third-largest retailer globally, and by August 2024, it has established itself as the largest retailer of beef, poultry, organic produce, and wine, with nearly one-third of American consumers shopping regularly at its warehouses. Costco holds the #11 position on the Fortune 500 list of the largest corporations in the United States by total revenue. Initially, Costco operated with a wholesale business model focused on signing up businesses as members, later expanding to include individual consumers and selling products aimed at them, including its private label brand.
Costco is headquartered in Issaquah, Washington, an eastern suburb of Seattle, although its Kirkland Signature house label reflects its previous location in Kirkland. The company's first warehouse opened in Seattle in 1983. Through a series of mergers, Costco's corporate lineage can be traced back to 1976 when it was established as a competitor to Price Club, which began in San Diego, California. As of May 2025, Costco operates 905 warehouses worldwide, with 86% situated in North America.
Related Instruments
Popular Symbols
