

Qualcomm Inc
QCOMToday
-10.98%
5 Days
-13.97%
1 Month
+15.75%
6 Months
+23.53%
Year to Date
+26.24%
1 Year
+46.34%
TradingKey Stock Score of Qualcomm Inc
Currency: USD Updated: 2026-06-04Key Insights
Qualcomm Inc's fundamentals are relatively healthy, and its growth potential is high.Its valuation is considered fairly valued, ranking 41 out of 106 in the Semiconductors & Semiconductor Equipment industry.Institutional ownership is very high.Over the past month, multiple analysts have rated it as Hold, with the highest price target at 178.09.In the medium term, the stock price is expected to trend up.The company has been performing strongly in the stock market over the past month, which is supported by its strong fundamentals and technicals.The stock price is trading sideways between the support and resistance levels, making it suitable for range-bound swing trading.
Qualcomm Inc's Score
Support & Resistance
Score Analysis
Media Coverage
Qualcomm Inc Highlights
Analyst Rating
Qualcomm Inc News
AI Faith Crumbles? Broadcom, Micron, AMD, Nvidia Tumble as Market Starts Questioning Jensen Huang
Jensen Huang announced that SK Hynix, Samsung Electronics, and Micron have secured new production authorizations; however, AI stocks fell broadly, reflecting waning investor enthusiasm for the AI boom.
US Pre-Market: Nasdaq Futures Lead Declines, Broadcom Slump Drags Down Chip Stocks
TradingKey - During the U.S. pre-market session on Thursday, June 4, the three major U.S. stock index futures diverged, with Nasdaq 100 futures leading the decline. Broadcom’s earnings report failed to meet high market expectations for AI chips, dragging down the semiconductor and AI infrastructure sectors. As of press time, Dow futures rose 0.79%, S&P 500 futures fell 0.4%, and Nasdaq 100 futures dropped 1.31%.

AI Chip Stocks Buck Trend. CPU Becomes Core Bottleneck for AI Agents, Intel Rises More Than 8%
TradingKey - On June 3, AI chip stocks led market gains. As of press time, Intel (INTC) rose 5.70%, Qualcomm (QCOM) 4.09%, AMD (AMD) 2.53%, and Broadcom (AVGO) 0.94%. The primary driver for AI chip stocks outperforming the broader market is the structural reconfiguration of the computing power industry chain in the AI Agent era. CPUs have evolved from traditional auxiliary roles to become the control hubs of agent systems, emerging as a new core bottleneck for large-scale AI deployment. This shift has fueled explosive growth in global CPU demand. Notably, the number of CPUs per AI server is increasing significantly; while the traditional GPU-to-CPU ratio was 8:1, Intel indicated that the ratio is expected to move toward 1:1 in the future.

Qualcomm CEO Sets Tone for ‘Year of AI Agents,’ Unveils Dragonfly Brand as Shares Tumble Nearly 9%
TradingKey - On June 1, Qualcomm (QCOM) CEO Cristiano Amon stated in his COMPUTEX 2026 keynote that 2026 will be the "Year of the AI Agent" and officially launched Dragonfly, a new brand for data center AI inference chips, marking Qualcomm's comprehensive entry into the data center computing market.

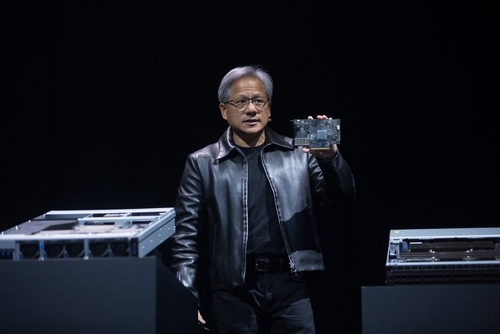
Qualcomm Plunges 10% in Premarket. Nvidia Launches New PC Superchip, Snapdragon Dominance May End
NVIDIA has launched a new superchip with NPU performance double that of the Snapdragon X Elite. This overwhelming competitive blow triggered a plunge in Qualcomm’s stock price.
US Pre-Market: Nvidia GTC Kickoff Ignites Tech Stock Rally, US Stock Futures Rise, Qualcomm Plummets Nearly 10%
TradingKey - In pre-market trading on Monday, June 1 (ET), investors' attention is focused on the latest developments in the Middle East while awaiting key labor market data to be released later this week. All three major US stock index futures moved higher; as of press time, Nasdaq 100 futures rose 0.17%, Dow 30 futures gained 0.28%, and S&P 500 futures climbed 0.23%.

Financial Indicators
EPS
Total revenue
Qualcomm Inc Info
Related Instruments
Popular Instruments
