

Intel Corp
INTCToday
+4.87%
5 Days
+8.87%
1 Month
+26.35%
6 Months
+147.87%
Year to Date
+37.10%
1 Year
+161.04%
TradingKey Stock Score of Intel Corp
Currency: USD Updated: 2026-02-06Key Insights
Intel Corp's fundamentals are relatively stable, with an industry-leading ESG disclosure.and its growth potential is high.Its valuation is considered fairly valued, ranking 46 out of 104 in the Semiconductors & Semiconductor Equipment industry.Institutional ownership is very high.Over the past month, multiple analysts have rated it as Hold, with the highest price target at 46.10.In the medium term, the stock price is expected to trend up.The company has been performing well in the stock market over the past month, which is supported by its strong fundamentals and technicals.The stock price is trading sideways between the support and resistance levels, making it suitable for range-bound swing trading.
Intel Corp's Score
Support & Resistance
Score Analysis
Media Coverage
Intel Corp Highlights
Analyst Rating
Intel Corp News
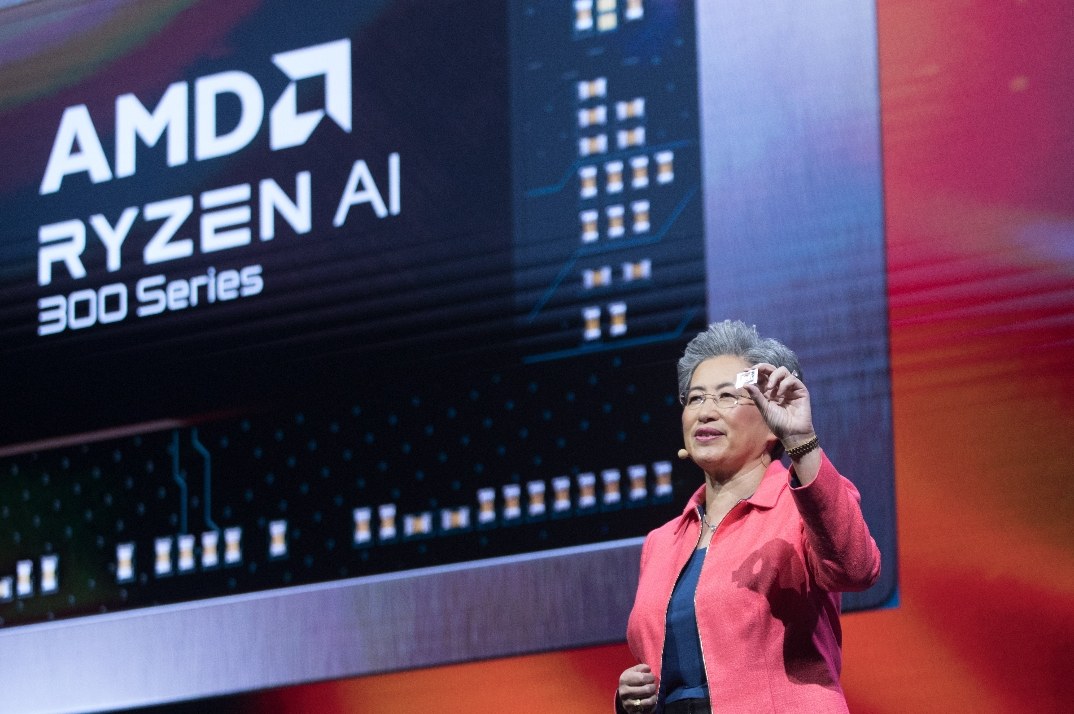
AMD Stock Surges 4% Before Earnings: What’s Powering the Optimism?
TradingKey - That Advanced Micro Devices (AMD) has become a market darling once again is evident. On Monday, shares in the chipmaker climbed 4 per cent, just 24 hours before its Tuesday afternoon earnings release. The rally followed a week in which the stock notched its seventh consecutive session o
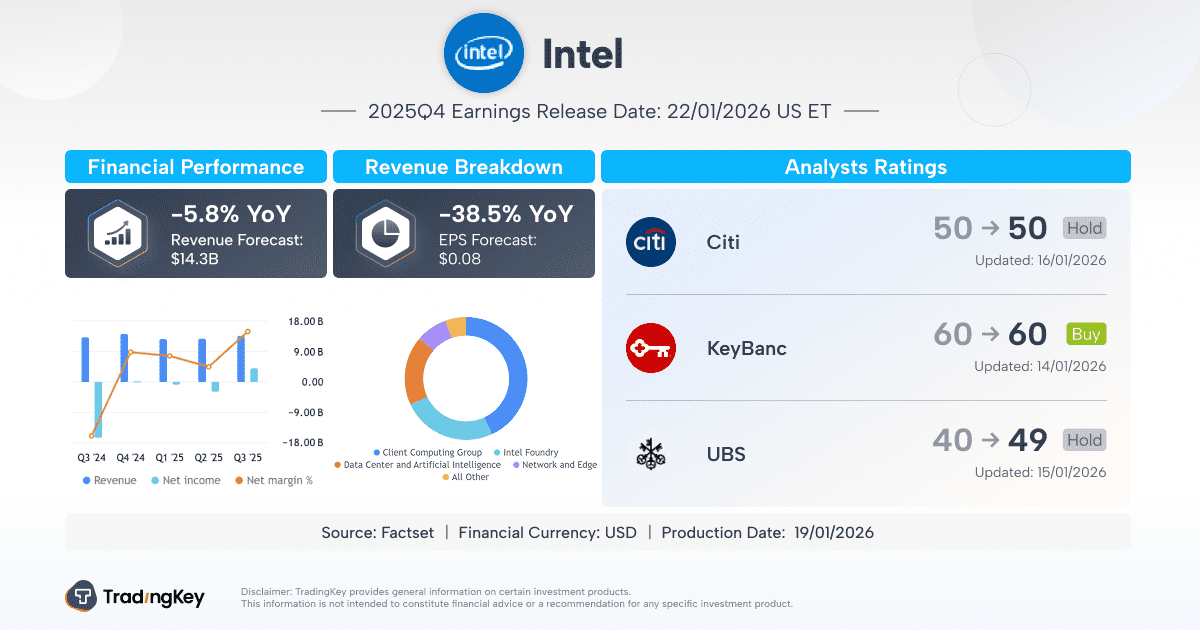
Intel’s Foundry Business Faces a Turning Point in 2026 — Earnings Could Be the Latest Catalyst
TradingKey - Amid a wave of “Sell America” sentiment sweeping across U.S. tech stocks, Intel (INTC) has stood out, bucking the broader market downturn. The stock has risen nearly 140% over the past year. For investors, the next potential catalyst lies just ahead—Intel’s upcoming earnings report.
Can Netflix (NFLX), Intel (INTC) Ignite Q4 Earnings; Davos Forum Draws Global Attention(The week ahead)
TradingKey - This week, heavyweights including Netflix, Johnson & Johnson, and Intel will release their earnings. The World Economic Forum Annual Meeting in Davos will be held this week, with Jensen Huang and Donald Trump among the attendees. On Friday, the Bank of Japan will announce its interest r

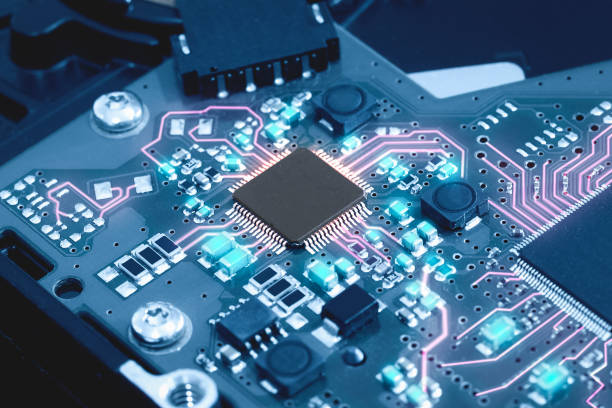
AI Chip Tariffs and TSMC’s Earnings Beat Fuel 2026’s Hardest-Hitting Semiconductor Rally
TradingKey - TSMC’s (TSM) latest quarterly earnings report shows that profit grew sharply, significantly exceeding market expectations on the back of robust demand for AI hardware, propelling its share price up by more than 4% in overnight trading.
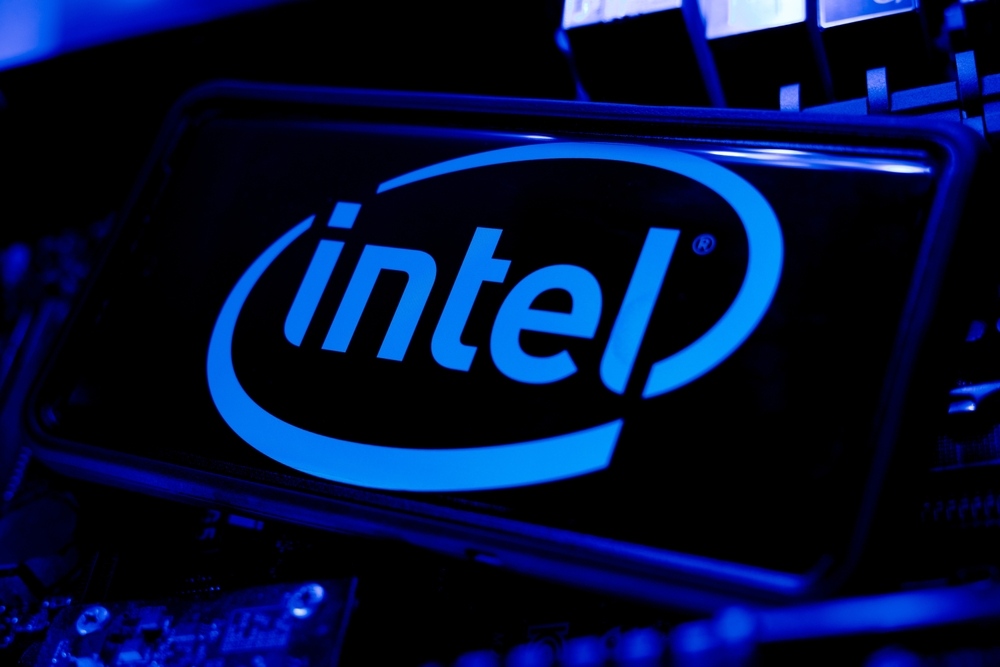
Intel Finally Reaps AI Dividend? Stock Hits 2-Year High as Analysts Raise Target to $60
TradingKey - Intel shares rose 7.3% on Tuesday to hit a nearly two-year high. The rally was primarily driven by a bullish research report released by KeyBanc Capital Markets on January 13, in which the investment bank upgraded Intel to "Overweight" and set a price target of $60, implying an upside o
TradingKey Previous Week’s Market Review & Analysis
U.S. equities rallied, led by Dow up 2.3%. Modest job growth, falling unemployment, and strong wage growth supported sentiment. Energy, utilities, industrials, materials, and small-caps (Russell 2000 +4.6%) outperformed. Fed minutes showed differing views on rates. Investors eye CPI data for inflati
Financial Indicators
EPS
Total revenue
Intel Corp Info
Related Instruments
Popular Symbols
