

ASML Holding NV
ASMLToday
+4.66%
5 Days
-0.70%
1 Month
+15.02%
6 Months
+98.14%
Year to Date
+32.07%
1 Year
+94.17%
TradingKey Stock Score of ASML Holding NV
Currency: USD Updated: 2026-02-06Key Insights
ASML Holding NV's fundamentals are relatively very healthy, with an industry-leading ESG disclosure.and its growth potential is high.Its valuation is considered fairly valued, ranking 41 out of 104 in the Semiconductors & Semiconductor Equipment industry.Institutional ownership is very high.Over the past month, multiple analysts have rated it as Buy, with the highest price target at 1358.60.In the medium term, the stock price is expected to trend up.The company has been performing well in the stock market over the past month, which is supported by its strong fundamentals and technicals.The stock price is trading sideways between the support and resistance levels, making it suitable for range-bound swing trading.
ASML Holding NV's Score
Support & Resistance
Score Analysis
Media Coverage
ASML Holding NV Highlights
ASML Holding N.V. is a Dutch multinational corporation that focuses on the development and manufacturing of photolithography machines utilized for producing integrated circuits. As of 2023, it stands as the largest supplier in the semiconductor sector and the sole global provider of extreme ultraviolet lithography machines essential for fabricating the most advanced chips. By November 2024, ASML ranked as the fourth most valuable company in Europe and the second most valued tech company on the continent, featuring a market capitalization of approximately US$264 billion.
Founded in 1984 as a joint venture between the Dutch firms Philips and ASM International, ASML became an independent corporation in 1995. Its corporate headquarters is located in Veldhoven, Netherlands, which serves as the center for research, development, manufacturing, and assembly. The company employs over 42,000 individuals from 143 different nationalities and is supported by a network of nearly 5,000 tier 1 suppliers. ASML caters to a global customer base and maintains over 60 service locations across 16 countries, with offices in the Netherlands, the United States, Belgium, France, Germany, Ireland, Israel, Italy, the United Kingdom, China, Hong Kong, Japan, South Korea, Malaysia, Singapore, and Taiwan.
The firm is publicly traded on both the AEX and Nasdaq stock exchanges under the ticker symbol ASML. It is also part of the Euro Stoxx 50 and Nasdaq-100 indices.
Analyst Rating
ASML Holding NV News
ASML Stock Split Coming? What AI Investors Should Know in 2026
TradingKey - ASML's (ASML) share price has soared above $1300 per share, which often causes investors to ask the question about a stock split when such a high stock price is reached.
ASML Backlog Hits 2027 as Bookings Double Estimates, Yet Shares Slump on Call
TradingKey - On January 28, ASML announced its financial results for the fourth quarter and full-year 2025. Q4 revenue reached a single-quarter record of €9.7 billion, driven in part by revenue recognition from two High NA systems. Full-year 2025 revenue totaled €32.7 billion with a net profit of €9

ASML Earnings Preview: Facing High Bar for Earnings Beat After Near 30% Rally in 2026
TradingKey - Ahead of the U.S. market open on Wednesday, January 28, Dutch lithography giant ASML will release its Q4 2025 and full-year financial results, while providing specific performance guidance for 2026. Although Wall Street majors Morgan Stanley, UBS, and JPMorgan Chase have upgraded their
ASML Q3 Preview: Outlook Under Pressure — Order Execution and New Guidance in Focus
TradingKey - ASML is set to release its third-quarter financial results on October 15 at 7:00 a.m. Central European Time. Over the past month, ASML’s shares have surged 45%, making it Europe’s most valuable company by market capitalization in September — its best-performing month in two decades.

Prediction: ASML Stock Will Soar Over the Next 10 Years. Here's 1 Reason Why.
Key PointsASML specializes in lithography machines and technology.It sells large and costly systems that last for decades.Its future looks very promising
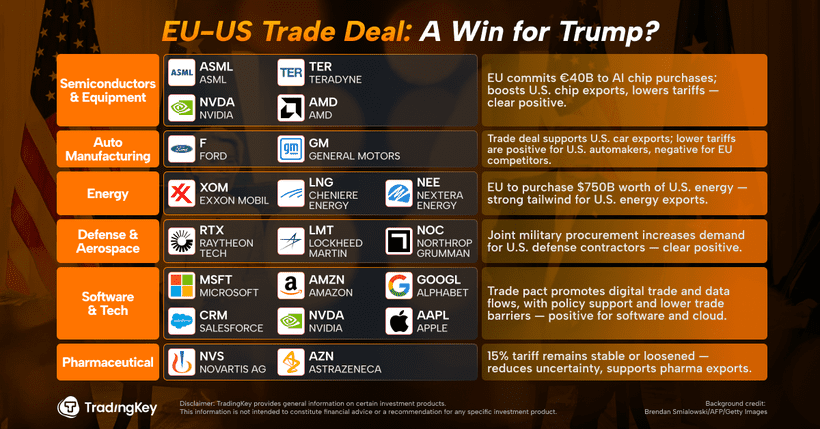
EU-US Trade Deal: A Win for Trump?
TradingKey - Markets have been buzzing this week around the new trade deal announced between the U.S. and the European Union. But while headlines touted a breakthrough, the details—and the politics—tell a more complicated story.
Financial Indicators
EPS
Total revenue
ASML Holding NV Info
ASML Holding N.V. is a Dutch multinational corporation that focuses on the development and manufacturing of photolithography machines utilized for producing integrated circuits. As of 2023, it stands as the largest supplier in the semiconductor sector and the sole global provider of extreme ultraviolet lithography machines essential for fabricating the most advanced chips. By November 2024, ASML ranked as the fourth most valuable company in Europe and the second most valued tech company on the continent, featuring a market capitalization of approximately US$264 billion.
Founded in 1984 as a joint venture between the Dutch firms Philips and ASM International, ASML became an independent corporation in 1995. Its corporate headquarters is located in Veldhoven, Netherlands, which serves as the center for research, development, manufacturing, and assembly. The company employs over 42,000 individuals from 143 different nationalities and is supported by a network of nearly 5,000 tier 1 suppliers. ASML caters to a global customer base and maintains over 60 service locations across 16 countries, with offices in the Netherlands, the United States, Belgium, France, Germany, Ireland, Israel, Italy, the United Kingdom, China, Hong Kong, Japan, South Korea, Malaysia, Singapore, and Taiwan.
The firm is publicly traded on both the AEX and Nasdaq stock exchanges under the ticker symbol ASML. It is also part of the Euro Stoxx 50 and Nasdaq-100 indices.
Related Instruments
Popular Symbols
