

Arm Holdings PLC
ARMToday
+11.56%
5 Days
+17.41%
1 Month
+6.93%
6 Months
-8.76%
Year to Date
+13.16%
1 Year
-23.88%
TradingKey Stock Score of Arm Holdings PLC
Currency: USD Updated: 2026-02-06Key Insights
Arm Holdings PLC's fundamentals are relatively very healthy, with an industry-leading ESG disclosure.and its growth potential is high.Its valuation is considered fairly valued, ranking 13 out of 104 in the Semiconductors & Semiconductor Equipment industry.Institutional ownership is very high.Over the past month, multiple analysts have rated it as Buy, with the highest price target at 145.93.In the medium term, the stock price is expected to trend down.The company has been performing well in the stock market over the past month, which is supported by its strong fundamentals and technicals.The stock price is trading sideways between the support and resistance levels, making it suitable for range-bound swing trading.
Arm Holdings PLC's Score
Support & Resistance
Score Analysis
Media Coverage
Arm Holdings PLC Highlights
Analyst Rating
Arm Holdings PLC News
AMD, Qualcomm and Arm Set to Report Earnings. Tesla Annual Shareholder Meeting Draws Market Attention【The week ahead】
TradingKey - This week, investors turn to a wave of earnings from companies at the heart of the artificial intelligence push. Key chipmakers reporting include AMD, Qualcomm, Arm, and Onsemi.

Intel Q3 Earnings Preview: Surge in Partnerships and Investments — Should You Bet Against a Turnaround?
TradingKey - Semiconductor chip manufacturer Intel (INTC) will report its Q3 2025 earnings after market close on Thursday, October 23, with investors watching closely to see if the company can finally prove it’s on a credible path to profitability. This quarter could mark a turning point, driven by

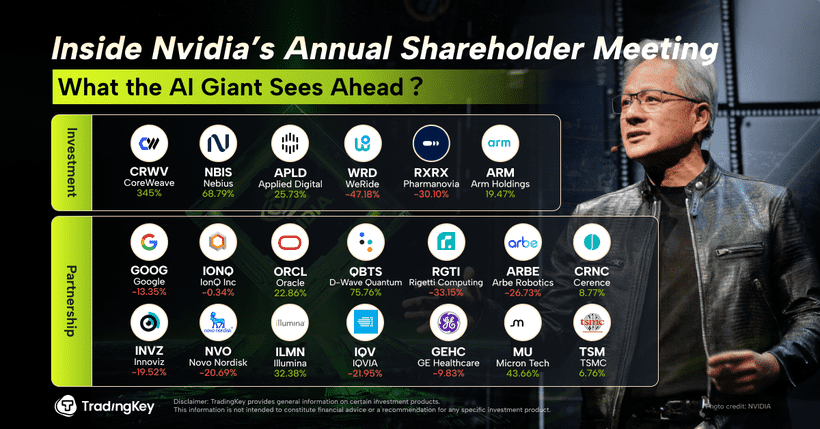
Inside Nvidia’s Investment Blueprint: Mapping the Next Empire of AI, Automation, and Infrastructure
TradingKey - Nvidia (NVDA) is no longer just the leader of GPU chips, the company is transforming into something more. As the company heads towards the much-awaited annual shareholder meet, a sharper mental picture comes as to what exactly it’s building: an empire beyond silicon.
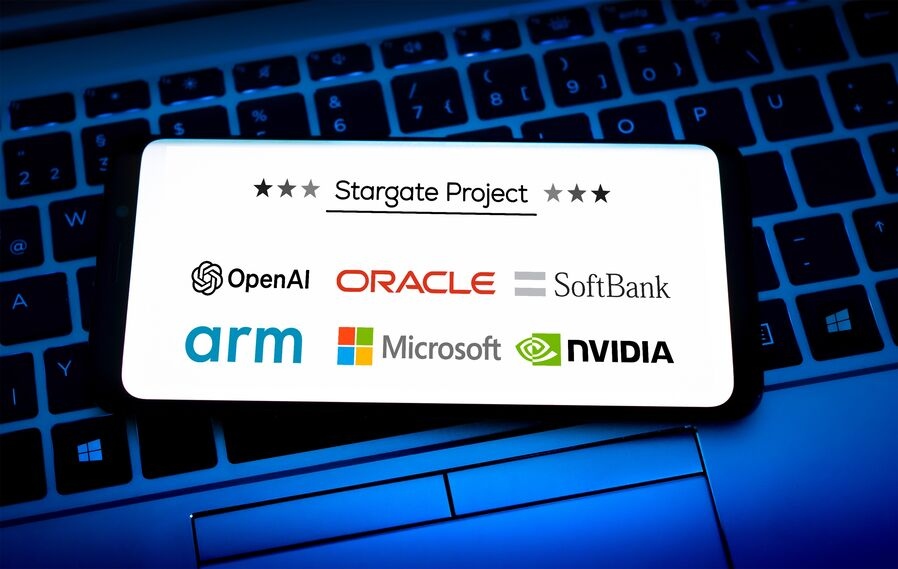
The Secret Layer Powering AI’s Future
TradingKey - Stargate aims to be a global AI inference routing layer, addressing latency and cost by decentralizing model deployment.
Financial Indicators
EPS
Total revenue
Arm Holdings PLC Info
Related Instruments
Popular Symbols
