

Starbucks Corp
SBUXToday
+3.52%
5 Days
+8.16%
1 Month
+14.72%
6 Months
+9.26%
Year to Date
+18.10%
1 Year
-11.36%
TradingKey Stock Score of Starbucks Corp
Currency: USD Updated: 2026-02-06Key Insights
Starbucks Corp's fundamentals are relatively very healthy, with an industry-leading ESG disclosure.and its growth potential is high.Its valuation is considered fairly valued, ranking 25 out of 120 in the Hotels & Entertainment Services industry.Institutional ownership is very high.Over the past month, multiple analysts have rated it as Buy, with the highest price target at 99.69.In the medium term, the stock price is expected to trend up.The company has been performing well in the stock market over the past month, which is supported by its strong fundamentals and technicals.The stock price is trading sideways between the support and resistance levels, making it suitable for range-bound swing trading.
Starbucks Corp's Score
Support & Resistance
Score Analysis
Media Coverage
Starbucks Corp Highlights
Analyst Rating
Starbucks Corp News
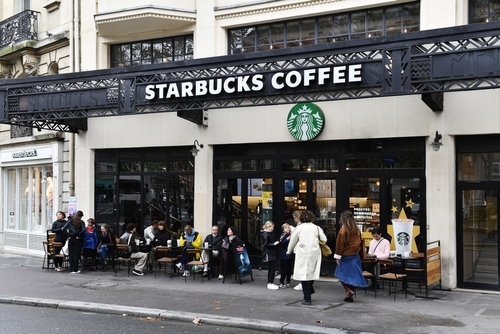
[Reuters Analysis] Starbucks' bet on local expertise could help it regain ground in China
SHANGHAI/BEIJING, Nov 5 (Reuters) - Starbucks' SBUX.O decision on Monday to sell up to 60% of its China business to local private equity firm Boyu Capital could help the hard-pressed brand regain ground in one of the world’s fastest-growing coffee markets.
Starbucks FY2025 Third Quarter Earnings Comments
Starbucks reported quarterly revenue of $9.5 billion, surpassing market expectations of $9.45 billion, with a year-over-year increase of 4.28%. This growth was primarily driven by new store openings, with a global net addition of 308 stores, bringing the total to 41,097. North America saw 3% growth,
Starbucks: The Premium Coffee Brand With a Pressured Bottom Line
TradingKey - Starbucks’ management is projecting confidence in its "Back to Starbucks" turnaround strategy, but the Q2 FY25 results paint a very different picture to investors.
Starbucks (SBUX): Q2 Numbers Look Worse than the Reality Actually Is, but Need to See More Drop in Price to become Attractive
TradingKey - Disappointing results but a change in the strategy towards ramping up hiring may pay off with higher growth and winning back market share (of course, at the expense of profitability). The current valuation of 25x 2026 expected earnings not enticing, better stay on the sideline with...
Congressional Stock Trades: Unlock the Wealth Code of U.S. Politicians on Capitol Hill
TradingKey - In the U.S. capital markets, beyond the savvy strategists at major institutions like Goldman Sachs, Morgan Stanley, and JPMorgan, a group of U.S. Congress members has investors’ attention with their market acumen and performance — earning them the nickname "Congressional Stock Gods."
[IN-DEPTH ANALYSIS] Starbucks (SBUX): Can Niccol Bring the People Back to Starbucks?
TradingKey - Starbucks Corporation is the leading roaster and retailer of specialty coffee globally. In addition to fresh, freshly brewed coffees, Starbucks’ offerings include many complimentary food items and a selection of premium teas and other beverages, sold mainly through the company’s...
Financial Indicators
EPS
Total revenue
Starbucks Corp Info
Related Instruments
Popular Symbols
