
tradingkey.logo
tradingkey.logo
Search

Silver

XAGUSD
Add to Watchlist

75.221USD

-0.383-0.51%
View Detailed Chart
Time
1m
15m
30m
1h
4h
D
W
Please select

Today

-0.51%

5 Days

-0.30%

1 Month

+2.04%

6 Months

+33.41%

Year to Date

+5.23%

1 Year

+128.18%

View Detailed Chart

TradingKey Timing Strategy - Silver

This is a long-only strategy where positions are determined entirely by the TK Alpha Gauge. The strategy scales long exposure proportionally based on positive gauge readings and maintains a flat position (zero lots) when the gauge is negative. Performance metrics are detailed below.

Alpha Gauge

The TK Alpha Gauge is a proprietary, comprehensive daily updated indicator developed by Tradingkey that reflects our outlook on specific financial instruments. Utilizing a long-proven AI framework, the index analyzes hundreds of proprietary price-volume, fundamental, and alternative data predictors. Values range from -100 to 100. Negative values signify a bearish (pessimistic) outlook, while positive values indicate a bullish (optimistic) stance. The further the value from zero, the stronger the quantitative signal. It provides quantitative insight into directional forecasts.

NeutralLast updated: May 29, 2026 2:05 AM

Strategy Data

Since Inception+433.54%
Today's Return0.00%
Annualized+22.11%
Sharpe Ratio0.85
Volatility+26.07%
Maximum Drawdown-38.90%
Benchmark Return+321.58%
Benchmark Annualized+18.73%

Historical Return

5Y
1M
3M
1Y
3Y
5Y
0.00%Historical Return
No Data

Silver News

Silver Price Forecast: Consolidates near $75.50, as bears eye 200-day SMA

Silver price retreats by 0.16% during the session, consolidating around the $75.00-$76.00 area, virtually unchanged, near the 50-day Simple Moving Average (SMA) at $75.70.
FxstreetFri, May 29
Silver price retreats by 0.16% during the session, consolidating around the $75.00-$76.00 area, virtually unchanged, near the 50-day Simple Moving Average (SMA) at $75.70.

Silver Price Forecast: XAG/USD struggles for direction despite US-Iran deal hopes, softer US Dollar

Silver (XAG/USD) trades flat on Friday, failing to capitalize on improving market sentiment surrounding a potential US-Iran peace deal even as the US Dollar (USD) slides to a two-week low. At the time of writing, XAG/USD trades around $75.60 and is on track to end the week virtually unchanged.

FxstreetFri, May 29
Silver (XAG/USD) trades flat on Friday, failing to capitalize on improving market sentiment surrounding a potential US-Iran peace deal even as the US Dollar (USD) slides to a two-week low. At the time of writing, XAG/USD trades around $75.60 and is on track to end the week virtually unchanged.

June Precious Metals Outlook: Gold May See a Periodic Recovery, Silver Volatility May Still Be the Market Consensus

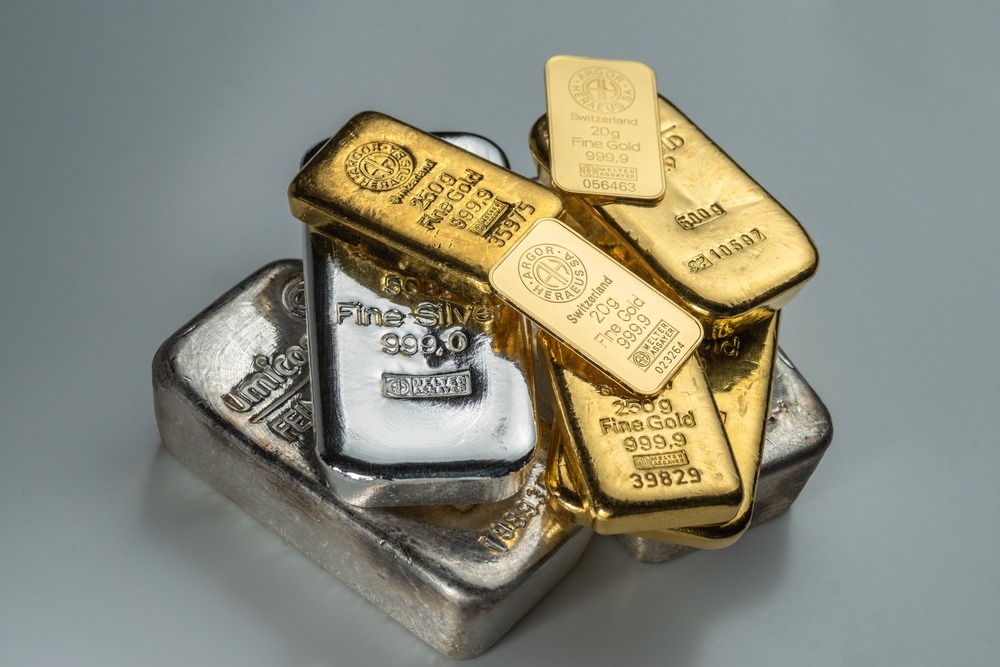
TradingKey - Since May, the precious metals market has continued its corrective trend. Spot gold fell below the $4,500 mark multiple times during the month before rebounding slightly, marking a significant retracement from its year-to-date highs. Spot silver briefly lost the $75 level within the month, with high-to-low volatility exceeding 15%.
TradingKeyFri, May 29
TradingKey - Since May, the precious metals market has continued its corrective trend. Spot gold fell below the $4,500 mark multiple times during the month before rebounding slightly, marking a significant retracement from its year-to-date highs. Spot silver briefly lost the $75 level within the month, with high-to-low volatility exceeding 15%.

Silver price today: Silver falls, according to FXStreet data

Silver prices (XAG/USD) fell on Friday, according to FXStreet data. Silver trades at $75.51 per troy ounce, down 0.17% from the $75.64 it cost on Thursday.
FxstreetFri, May 29
Silver prices (XAG/USD) fell on Friday, according to FXStreet data. Silver trades at $75.51 per troy ounce, down 0.17% from the $75.64 it cost on Thursday.

Silver Price Forecasts: XAG/USD stalls below $76.00 amid a cautious market optimism

Silver (XAG/USD) shows marginal losses on Friday and is on track to end the week little changed after wavering within a $7 range around $76.

FxstreetFri, May 29
Silver (XAG/USD) shows marginal losses on Friday and is on track to end the week little changed after wavering within a $7 range around $76.

Silver Price Forecast: XAG/USD hovers around $76.00 as interest rate concerns ease

Silver price (XAG/USD) gains ground for the second successive day, trading around $75.80 per troy ounce during the Asian hours on Friday.

FxstreetFri, May 29
Silver price (XAG/USD) gains ground for the second successive day, trading around $75.80 per troy ounce during the Asian hours on Friday.

More Details of Silver

Silver is a chemical element with the symbol Ag and the atomic number 47. It is a soft, white, lustrous metal that has the highest electrical and thermal conductivity of any metal. Silver is used for various purposes, such as making jewelry, coins, electronics, and photography. Silver can form compounds with different oxidation states. Silver also forms alloys with other metals, such as copper, gold, and zinc. Silver has many applications in various fields, such as medicine, industry, art, and science. Silver has antibacterial properties, and is used in wound dressings, dental fillings, and water purification. Silver is also used as a catalyst, a coating, a solder, and a superconductor. Silver has a long history and cultural significance and is associated with purity, elegance, and wealth. Silver is considered a commodity that can be traded in the global market, and a potential investment option for those who seek to diversify their portfolio and hedge against inflation and uncertainty. Some of the common ways to invest in silver are by buying physical silver, such as coins, bars, or bullion; buying shares of silver mining companies or silver streaming companies; buying silver futures or options contracts. Silver is a scarce and valuable metal, with a high demand and a limited supply in the global market. It has a low correlation with other assets, such as stocks and bonds, which can reduce the overall risk and volatility of the portfolio. Besides, It has a high potential for growth and innovation, as it is used in various emerging and expanding sectors, such as renewable energy, biotechnology, and nanotechnology. It also has a high sensitivity to inflation and economic downturns, which can increase its appeal and attractiveness as a safe-haven asset. However silver has high competition and substitution, which can reduce its demand and value in the long term. For example, silver can be replaced by cheaper or more efficient metals, such as copper, aluminum, or platinum.

What is silver?

Silver is a precious metal with critical industrial uses in green energy.

What is silver all time high?

The silver all time high is $121.67/oz (Jan 29, 2026).

What's the current price of silver (XAGUSD) ?

The opening price of silver (xagusd) on March 5, 2026 was 82.33 USD/ounce.

What is the 5 year forecast of silver?

The 5 year forecast of silver price is targeting $140–$200/oz by 2030.

What factors affect the price of silver?

Silver prices are mainly driven by:

  1. Industrial Demand: Silver is significantly used in industrial sectors like solar panels, electric vehicles, electronics and AI hardware.
  2. Investment Demand: Silver is regarded as safe haven against inflation and economic uncertainty.
  3. Monetary Policy and Macroeconomics: Interest rates and U.S. Dollar strength boost or decrease silver prices.
  4. Other Factors: Mining supply constraints, geopolitical tensions and market sentiment are play a role as well.

What is the rate of return for silver?

The rate of return for silver can vary significantly over different time periods. As of the most recent data available, the average annual return for silver over the past decade has been approximately 5% to 10%. However, it is essential to note that past performance is not indicative of future results, and the rate of return for silver can fluctuate based on factors such as supply and demand dynamics, geopolitical events, inflation rates, and overall market sentiment.

What are the top countries that produce silver?

The top countries that produce silver include Mexico, Peru, China, Russia, and Australia. These nations are among the leading global producers of silver, with significant reserves and extraction capabilities. Mexico and Peru are historically known for their high silver production, while China, Russia, and Australia also play key roles in the global silver market. These countries contribute significantly to the world's silver supply

What exactly is an "Alpha"?

An Alpha is a proprietary mathematical formula designed to identify and exploit specific market inefficiencies. Think of it as a quantitative "rule" that has demonstrated a historical ability to forecast price movements. By translating complex market patterns into actionable signals, Alpha provides the statistical edge necessary to consistently outperform the market.

How is TK Alpha Gauge Calculated?

The Gauge is powered by a long-proven AI framework that analyzes hundreds of predictors across three categories: Price-Volume: Historical and real-time movement trends. Fundamentals: Underlying financial health and valuation metrics. Alternative Data: Unique datasets that capture non-traditional market signals. The final score represents the signal's strength; the further the value is from zero, the higher the quantitative conviction.

How often is TK Alpha Gauge calculated?

Every component and the Index are calculated as soon as new data becomes available daily.

How to use TK Alpha Gauge?

The Index serves as a systematic tool to remove emotional bias and determine position sizing. Depending on the asset and strategy, it can be applied in two primary ways: 1. Long-Only Strategy (e.g., GLD) Commonly used for ETFs like GLD, the gauge dictates exposure based only on positive momentum: Positive Reading: Scale long exposure proportionally to the gauge value. Negative Reading: Maintain a flat position (zero lots) to avoid downside risk. 2. Long/Short Strategy (e.g., Gold Futures) In highly liquid markets like gold futures, the gauge allows for active trading in both directions: Bullish (>0): Take a long position, scaling the size as the value moves toward 100. Bearish (<0): Take a short position, increasing the short exposure as the value moves toward -100. Neutral (0): Exit all positions to remain flat during periods of no clear signal.

How does AI improve the investment process?

Unlike static technical indicators, machine learning models recognize complex, non-linear patterns, allowing for more precise predictions of price movements in volatile markets. AI can facilitate the processing of massive dataset and synthesizes hundreds of high-performance predictors to generate meaningful trading signals. Adaptive models continuously learn from live market shifts, automatically tuning strategy parameters to maintain peak performance across different economic regimes.

How do you use Volume and Price together?

We analyze the relationship between price action and market participation (volume) to measure the conviction behind a move. Ideally, price and volume should trend in harmony. Our system is designed to monitor the synergy between these two variables. By identifying the periods of decoupling, our framework can proactively shift to a defensive posture, prioritizing capital preservation.

How does the "Super Alpha" ensemble help me?

Rather than relying on a single “rule”, the "Super Alpha" ensemble aggregates hundreds of diverse predictors across three distinct categories. This creates a robust system: If one predictor is skewed by temporary market noise, the remaining signals provide a stabilizing correction. This multi-predictor ensemble approach is designed to maintain portfolio resilience and steady performance, even during periods of high market volatility.

What are Deep Learning and Neural Networks?

Deep learning is a subset of machine learning that uses highly sophisticated artificial neural networks to model and replicate the way the human brain processes information. At its core, deep learning relies on multi-layered deep neural networks. These networks consist of interconnected nodes (called neurons) organized in multiple layers. Data flows through these layers in a highly connected manner, allowing the model to automatically learn complex patterns and representations from large amounts of data. This architecture makes deep learning particularly powerful for tasks such as prediction, classification, and pattern recognition.

What is TK Alpha Gauge?

The TK Alpha Gauge is a proprietary, daily updated indicator designed to provide a clear outlook on specific financial instruments. Developed by TradingKey, the gauge acts as a quantitative compass for market direction. Much like how sentiment indices track the "mood" of the market, the Alpha Gauge utilizes a long-proven AI framework to strip away emotional bias and provide a high-conviction forecast based on cold, hard data.

Related Instruments

Silver

75.221
-0.383-0.51%
KeyAI