

RTX Corp
RTXToday
+1.37%
5 Days
-1.13%
1 Month
+4.34%
6 Months
+27.55%
Year to Date
+8.32%
1 Year
+54.26%
TradingKey Stock Score of RTX Corp
Currency: USD Updated: 2026-02-06Key Insights
RTX Corp's fundamentals are relatively healthy, with an industry-leading ESG disclosure.and its growth potential is high.Its valuation is considered fairly valued, ranking 10 out of 70 in the Aerospace & Defense industry.Institutional ownership is very high.Over the past month, multiple analysts have rated it as Buy, with the highest price target at 207.03.In the medium term, the stock price is expected to trend up.The company has been performing well in the stock market over the past month, which is supported by its strong fundamentals and technicals.The stock price is trading sideways between the support and resistance levels, making it suitable for range-bound swing trading.
RTX Corp's Score
Support & Resistance
Score Analysis
Media Coverage
RTX Corp Highlights
Analyst Rating
RTX Corp News
RTX: Driving Breakthroughs in Defense Technology and Commercial Aviation
RTX Corporation (NYSE: RTX) is a dominant force in aerospace and defense, perfectly positioned to ride the wave of growing global defense budgets and a booming commercial aviation market.
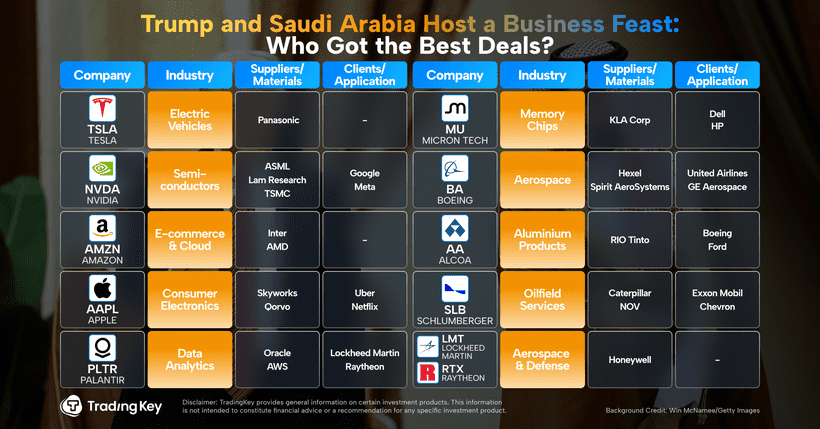
Trump and the Middle East Host a Business Feast—Who Cut the Best Deals?
TradingKey - US President Donald Trump has embarked on his first official visit to the Middle East during his term in office this week, traveling to Saudi Arabia, Qatar, and the United Arab Emirates.
Financial Indicators
EPS
Total revenue
RTX Corp Info
Related Instruments
Popular Symbols
