

Lockheed Martin Corp
LMTToday
+2.24%
5 Days
-1.68%
1 Month
+25.50%
6 Months
+44.77%
Year to Date
+28.93%
1 Year
+40.32%
TradingKey Stock Score of Lockheed Martin Corp
Currency: USD Updated: 2026-02-06Key Insights
Lockheed Martin Corp's fundamentals are relatively stable, with an industry-leading ESG disclosure.and its growth potential is significant.Its valuation is considered fairly valued, ranking 46 out of 70 in the Aerospace & Defense industry.Institutional ownership is very high.Over the past month, multiple analysts have rated it as Hold, with the highest price target at 657.75.In the medium term, the stock price is expected to trend up.Despite a good stock market performance and strong technicals over the past month, the fundamentals don't support the current trend.The stock price is trading sideways between the support and resistance levels, making it suitable for range-bound swing trading.
Lockheed Martin Corp's Score
Support & Resistance
Score Analysis
Media Coverage
Lockheed Martin Corp Highlights
Analyst Rating
Lockheed Martin Corp News
Lockheed Martin (LMT): Robust Backlog & Geopolitical Tailwinds Bolster Long-Term Outlook Despite Short-Term Project Setbacks
TradingKey - The U.S. is increasing defense spending significantly over the years due to rising global tensions and the need to modernize its military capabilities. The defense sector has outperformed broader markets fueled by reliable government contracts and innovation.
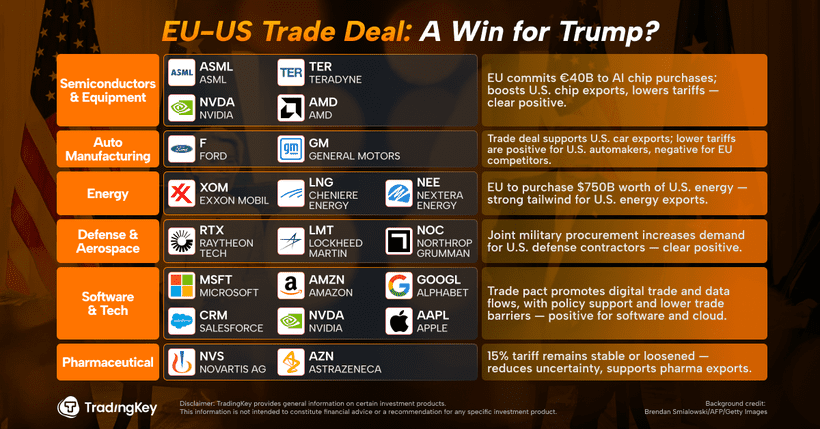
EU-US Trade Deal: A Win for Trump?
TradingKey - Markets have been buzzing this week around the new trade deal announced between the U.S. and the European Union. But while headlines touted a breakthrough, the details—and the politics—tell a more complicated story.
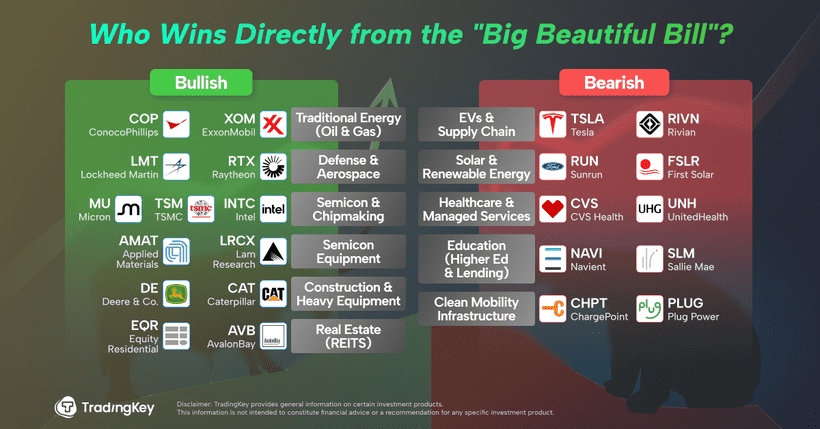
Who Wins Directly from the "Big Beautiful Bill"?
TradingKey - Last Friday, U.S. Congress passed what Donald Trump proudly calls the “Big Beautiful Bill.” The legislation has already given U.S. markets a short-term lift—by unlocking new liquidity and opening the door to valuation re-rating in select sectors. Expect winners in energy, defense, and m
Will the Strait of Hormuz Remain at Risk Despite the Iran–Israel Ceasefire?
TradingKey - On June 24, U.S. President Donald Trump announced a "temporary ceasefire" between the U.S. and Iran. However, Iran has not fully endorsed the agreement’s validity.
.png)
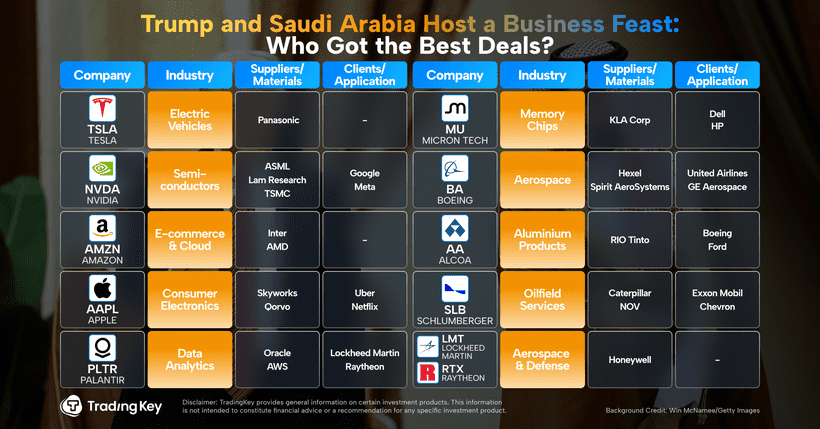
Trump and the Middle East Host a Business Feast—Who Cut the Best Deals?
TradingKey - US President Donald Trump has embarked on his first official visit to the Middle East during his term in office this week, traveling to Saudi Arabia, Qatar, and the United Arab Emirates.
What Are Defensive Stocks? Should You Buy Them Now? Are Defense Stocks Defensive?
TradingKey - Defensive stocks are seen as "safe havens" during economic downturns because their products or services maintain stable demand regardless of economic cycles. Warren Buffett’s investment success is largely attributed to his preference for defensive blue-chip stocks.

Financial Indicators
EPS
Total revenue
Lockheed Martin Corp Info
Related Instruments
Popular Symbols
