

PayPal Holdings Inc
PYPLToday
+1.30%
5 Days
-23.29%
1 Month
-30.92%
6 Months
-40.75%
Year to Date
-30.76%
1 Year
-47.72%
TradingKey Stock Score of PayPal Holdings Inc
Currency: USD Updated: 2026-02-06Key Insights
PayPal Holdings Inc's fundamentals are relatively healthy, with an industry-leading ESG disclosure.and its growth potential is high.Its valuation is considered fairly valued, ranking 67 out of 156 in the Professional & Commercial Services industry.Institutional ownership is very high.Over the past month, multiple analysts have rated it as Hold, with the highest price target at 56.05.In the medium term, the stock price is expected to trend down.Despite a very weak market performance over the past month, the company shows strong fundamentals and technicals.The stock price is trading sideways between the support and resistance levels, making it suitable for range-bound swing trading.
PayPal Holdings Inc's Score
Support & Resistance
Score Analysis
Media Coverage
PayPal Holdings Inc Highlights
Analyst Rating
PayPal Holdings Inc News
What is the Future of Stablecoins? Here are Some Stablecoin Stocks to Watch
With regulations solidifying, institutional money flowing in, and global market expansion accelerating, stablecoin-related stocks could experience unprecedented growth.
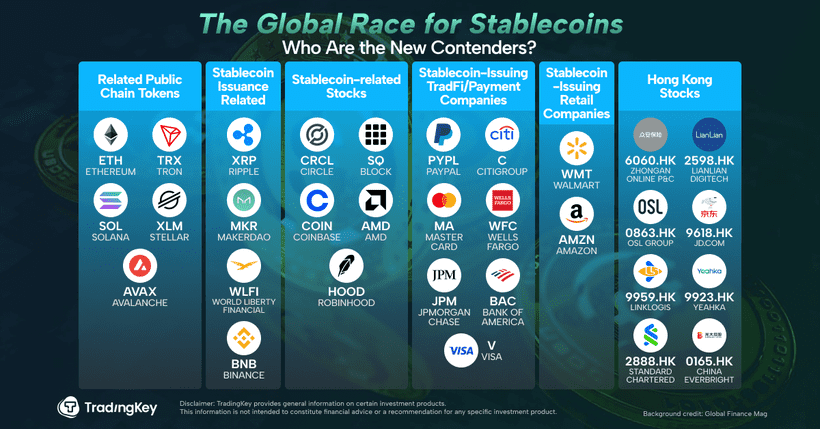
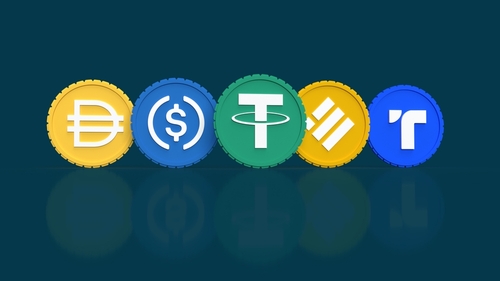
What Are Stablecoins — and Could They Replace the U.S. Dollar’s Global Dominance?
A stablecoin is a cryptocurrency designed to maintain price stability, typically pegged to fiat currencies like the U.S. dollar (USD), euro (EUR) or commodities such as gold. Its primary purpose is to reduce volatility, making it a bridge between traditional finance and the crypto world.
Inside PayPal’s Quiet Comeback
TradingKey - PayPal Holdings Inc. (PYPL) entered 2025 as a company on a transformation path. From a darling of fintech innovation and dominance of digital payments, the company has matured into a global financial infrastructure company with reach into nearly all corners of digital commerce.
[IN-DEPTH ANALYSIS] PayPal's Stagnant Stock: Is $97 the Breakout Price for 2025?
TradingKey - PayPal is a leading digital payment platform that acts as an intermediary in the payment process, connecting merchants and consumers. Trusted brand with 434M users, 90M on Venmo, driving $1.68T TPV with strong cross-border reach.Boosted by e-commerce, mobile payments, emerging markets,
Financial Indicators
EPS
Total revenue
PayPal Holdings Inc Info
Related Instruments
Popular Symbols
