

PDD Holdings Inc
PDDToday
+3.65%
5 Days
+4.14%
1 Month
-14.21%
6 Months
-7.64%
Year to Date
-7.20%
1 Year
-6.64%
TradingKey Stock Score of PDD Holdings Inc
Currency: USD Updated: 2026-02-06Key Insights
PDD Holdings Inc's fundamentals are relatively very healthy, with an industry-leading ESG disclosure.and its growth potential is high.Its valuation is considered fairly valued, ranking 104 out of 482 in the Software & IT Services industry.Institutional ownership is very high.Over the past month, multiple analysts have rated it as Buy, with the highest price target at 146.36.In the medium term, the stock price is expected to trend down.Despite a weak stock market performance over the past month, the company shows strong fundamentals and technicals.The stock price is trading sideways between the support and resistance levels, making it suitable for range-bound swing trading.
PDD Holdings Inc's Score
Support & Resistance
Score Analysis
Media Coverage
PDD Holdings Inc Highlights
Analyst Rating
PDD Holdings Inc News
US-China Summit: 5 Key Issues to Watch in First Trump-Xi Meeting in Six Years
TradingKey - The high-stakes meeting between U.S. President Donald Trump and Chinese President Xi Jinping on Thursday, October 30, stands as the cornerstone of Trump's ongoing five-day Asia trip after returning to the White House. This summit follows a constructive round of trade negotiations, which

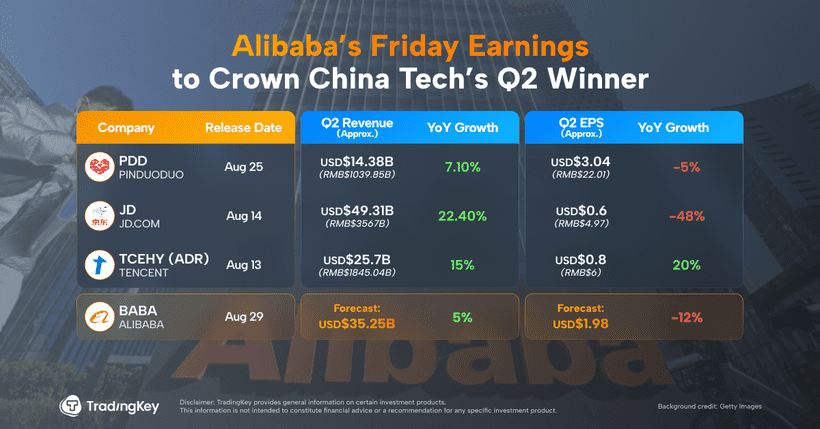
Alibaba’s Friday Earnings to Crown China Tech’s Q2 Winner
TradingKey - Names like JD.com, Pinduoduo, Tencent, and Alibaba represent the top-tier of Chinese tech stocks trading in the U.S. But their FY2025 Q2 earnings paint very different pictures.
PDD’s Next Growth Engine: Trading Profit for Ecosystem, Technology for Efficiency
TradingKey - Pinduoduo (PDD) Q1 2025 results don’t look good. The stock fell for several days after earnings, with market sentiment taking a visible hit.

Riding the Tariff Waves: Asset Allocation and Investment Strategies
TradingKey - The uncertainty of Trump’s tariff policies is disrupting global markets, making already volatile markets even more unpredictable. This paper analyses multi-assets, sectors, and individual stock strategies to identify reliable investment opportunities in an uncertain political...

Alibaba (BABA) Q4 2024 Earnings Preview: Will the Chinese Tech Rally Continue?
Alibaba will report its fourth quarterly earnings for this fiscal year on Thursday, after the bell. The stock has been performing solidly in the past twelve months with 55% increase, mostly driven by the company’s AI initiatives and recovery in the consumer sentiment in China. Tomorrow we will...

PDD Holdings Q4 2024 Earnings: 6 Key Takeaways from Temu Owner
One of those challengers was PDD Holdings (NASDAQ: PDD), the parent company of Chinese e-commerce platform Pinduoduo and the fast-expanding Temu.
Financial Indicators
EPS
Total revenue
PDD Holdings Inc Info
Related Instruments
Popular Symbols
