

Netflix Inc
NFLXToday
+1.64%
5 Days
-1.55%
1 Month
-9.40%
6 Months
-30.36%
Year to Date
-12.33%
1 Year
-18.93%
TradingKey Stock Score of Netflix Inc
Currency: USD Updated: 2026-02-06Key Insights
Netflix Inc's fundamentals are relatively very healthy, with an industry-leading ESG disclosure.and its growth potential is high.Its valuation is considered fairly valued, ranking 97 out of 482 in the Software & IT Services industry.Institutional ownership is very high.Over the past month, multiple analysts have rated it as Buy, with the highest price target at 113.19.In the medium term, the stock price is expected to trend down.Despite a weak stock market performance over the past month, the company shows strong fundamentals.The stock price is trading sideways between the support and resistance levels, making it suitable for range-bound swing trading.
Netflix Inc's Score
Support & Resistance
Score Analysis
Media Coverage
Netflix Inc Highlights
Netflix, Inc. is an American media enterprise founded in 1997 by Reed Hastings and Marc Randolph in Scotts Valley, California, currently headquartered in Los Gatos, California, with production offices and stages located at Hollywood studios in Los Angeles and Albuquerque Studios. The company owns and operates a subscription video on-demand service that features original content, acquired programming, and third-party material licensed from other producers and distributors. Notably, Netflix is the first streaming media company to join the Motion Picture Association.
Initially, Netflix offered both DVD sales and rentals by mail; however, sales were discontinued within the first year to concentrate on the rental business. In 2007, the company launched streaming media and video on demand, expanding its reach to Canada in 2010, followed by Latin America and the Caribbean. In 2011, Netflix began acquiring and producing original content, starting with the crime drama Lilyhammer.
As of now, the company holds the 117th position on the Fortune 500 and ranks 219th on the Forbes Global 2000. It is the second-largest entertainment/media company by market capitalization as of February 2022. In 2021, Netflix was recognized as the eighth-most trusted brand globally by Morning Consult. Throughout the 2010s, it emerged as the top-performing stock in the S&P 500 index, with a total return of 3,693%.
The company has co-CEOs, Greg Peters and Ted Sarandos, who operate from Los Gatos and Los Angeles, respectively. Additionally, it maintains international offices across Asia, Europe, and Latin America, including locations in Canada, France, Brazil, the Netherlands, India, Italy, Japan, Poland, South Korea, and the United Kingdom. Netflix also has production hubs in Los Angeles, Albuquerque, London, Madrid, Vancouver, and Toronto.
Analyst Rating
Netflix Inc News
Will Roku Stock Outperform Netflix in 2026? Is It a Buy Now?
TradingKey - To understand what the company behind Roku stock (ROKU) does, consider Roku TVs, Roku streaming sticks, and the Roku Channel. Roku builds and operates the software and tech stack of streaming TVs, which powers its ecosystem. Roku's lower-margin hardware draws in users, but its business
Disney Trend Forecast: Disney FY26 First Quarter Net Profit Falls 6% Stock Price Slumps 7.4% Can Stock Price Continue to Rise in 2026?
TradingKey - At the start of 2026, global entertainment giant Disney (DIS) faced a disappointing start to the year. Its Q1 FY2026 earnings report showed that revenue grew 5% year-on-year to $25.98 billion, seemingly achieving steady growth; however, net profit fell 6% year-on-year to $2.4 billion. N

Netflix Slumps as All-Cash Warner Bid Drains the Buyback Tank
TradingKey - After hours on January 20 ET, Netflix (NFLX) released its Q4 2025 earnings report. Despite both revenue and earnings beating expectations, the stock slumped nearly 5% after hours, retreating to its lowest level since the panic of last April.
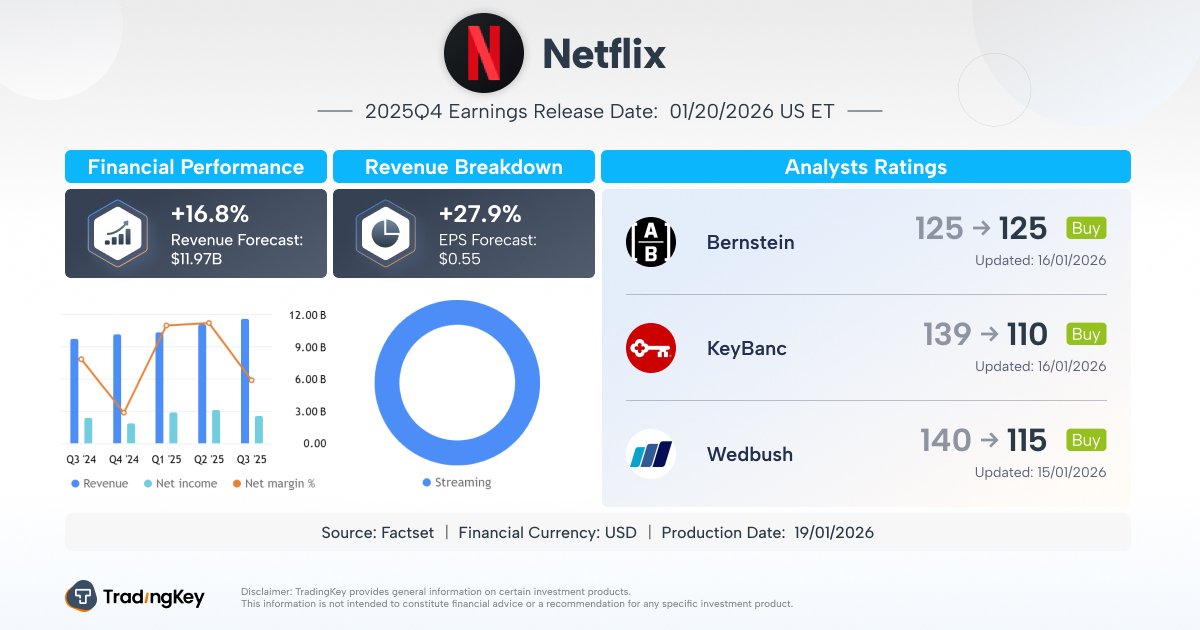
Netflix Q4 Earnings Preview: Ad Business May Lead Growth Engine, Warner Bros. Deal Is Key Stock Variable
TradingKey - Streaming giant Netflix (NFLX.US) will release its fourth-quarter earnings report after the market close on January 20. However, market focus may no longer be limited to the quarterly results themselves, but is gradually shifting toward the latest progress and long-term strategic implic
Can Netflix (NFLX), Intel (INTC) Ignite Q4 Earnings; Davos Forum Draws Global Attention(The week ahead)
TradingKey - This week, heavyweights including Netflix, Johnson & Johnson, and Intel will release their earnings. The World Economic Forum Annual Meeting in Davos will be held this week, with Jensen Huang and Donald Trump among the attendees. On Friday, the Bank of Japan will announce its interest r

Netflix Stock Analysis: Why Netflix Stock Keeps Falling, and When Should Investors Buy Netflix Stock?
While the final terms for Netflix's acquisition of WBD remain uncertain in the short term, we view the recent decline, driven by market sentiment, as a significant long-term undervalued opportunity. The return to more realistic valuations enhances the investment appeal of Netflix stock.
Financial Indicators
EPS
Total revenue
Netflix Inc Info
Netflix, Inc. is an American media enterprise founded in 1997 by Reed Hastings and Marc Randolph in Scotts Valley, California, currently headquartered in Los Gatos, California, with production offices and stages located at Hollywood studios in Los Angeles and Albuquerque Studios. The company owns and operates a subscription video on-demand service that features original content, acquired programming, and third-party material licensed from other producers and distributors. Notably, Netflix is the first streaming media company to join the Motion Picture Association.
Initially, Netflix offered both DVD sales and rentals by mail; however, sales were discontinued within the first year to concentrate on the rental business. In 2007, the company launched streaming media and video on demand, expanding its reach to Canada in 2010, followed by Latin America and the Caribbean. In 2011, Netflix began acquiring and producing original content, starting with the crime drama Lilyhammer.
As of now, the company holds the 117th position on the Fortune 500 and ranks 219th on the Forbes Global 2000. It is the second-largest entertainment/media company by market capitalization as of February 2022. In 2021, Netflix was recognized as the eighth-most trusted brand globally by Morning Consult. Throughout the 2010s, it emerged as the top-performing stock in the S&P 500 index, with a total return of 3,693%.
The company has co-CEOs, Greg Peters and Ted Sarandos, who operate from Los Gatos and Los Angeles, respectively. Additionally, it maintains international offices across Asia, Europe, and Latin America, including locations in Canada, France, Brazil, the Netherlands, India, Italy, Japan, Poland, South Korea, and the United Kingdom. Netflix also has production hubs in Los Angeles, Albuquerque, London, Madrid, Vancouver, and Toronto.
Related Instruments
Popular Symbols
