

Occidental Petroleum Corp
OXYToday
+2.71%
5 Days
+2.03%
1 Month
+10.95%
6 Months
+8.86%
Year to Date
+12.62%
1 Year
-1.43%
TradingKey Stock Score of Occidental Petroleum Corp
Currency: USD Updated: 2026-02-06Key Insights
Occidental Petroleum Corp's fundamentals are relatively healthy, with an industry-leading ESG disclosure.and its growth potential is significant.Its valuation is considered fairly valued, ranking 43 out of 119 in the Oil & Gas industry.Institutional ownership is very high.Over the past month, multiple analysts have rated it as Hold, with the highest price target at 49.30.In the medium term, the stock price is expected to trend up.The company has been performing well in the stock market over the past month, which is supported by its strong fundamentals and technicals.The stock price is trading sideways between the support and resistance levels, making it suitable for range-bound swing trading.
Occidental Petroleum Corp's Score
Support & Resistance
Score Analysis
Media Coverage
Occidental Petroleum Corp Highlights
Analyst Rating
Occidental Petroleum Corp News
Treasury Secretary Bessent, Multiple Fed Officials Set for Busy Speaking Week.CPI Release Remains in Limbo.【The week ahead】
TradingKey - U.S. stocks pulled back last week from record highs, with the tech sector posting its largest decline in nearly six months.
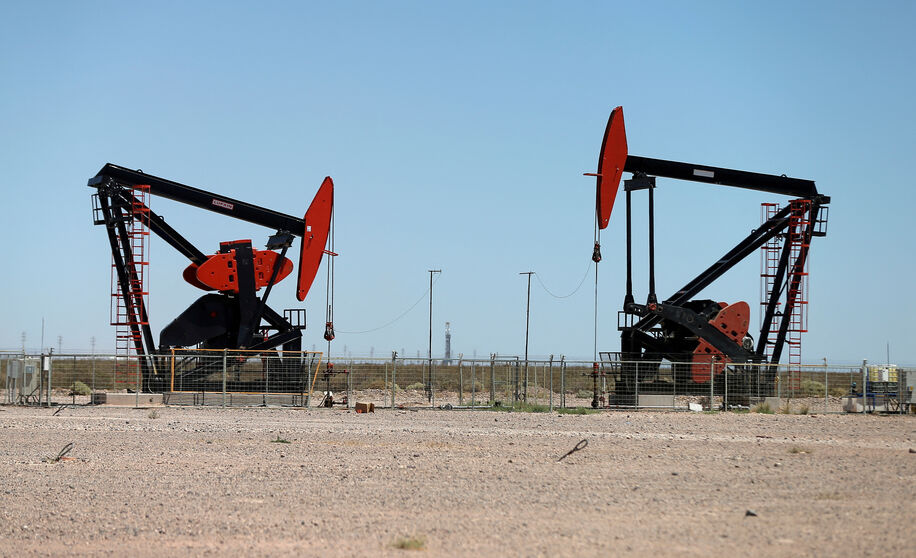
The Battle for Oil Market Share: Can OPEC Reclaim Ground from U.S. Shale Producers?
TradingKey - In the global oil market, both OPEC, the traditional oil cartel, and the United States, powered by its shale revolution, hold significant influence over pricing. In May 2025, OPEC announced it would increase production for the third consecutive month, signaling a shift in strategy aimed
[IN-DEPTH ANALYSIS] Occidental Petroleum (OXY): Why Buffett Bet on OXY as ‘Cash Cow’ Despite Flat Oil Prices
TradingKey - Occidental Petroleum Corporation (OXY.N) was founded in 1920 and is headquartered in Houston, Texas, USA. The company has launched an asset divestiture plan to de - leverage. The growth in high - quality oil and gas production generates cash flow for debt repayment and dividend growth

Financial Indicators
EPS
Total revenue
Occidental Petroleum Corp Info
Related Instruments
Popular Symbols
