[IN-DEPTH ANALYSIS] Occidental Petroleum (OXY): Why Buffett Bet on OXY as ‘Cash Cow’ Despite Flat Oil Prices


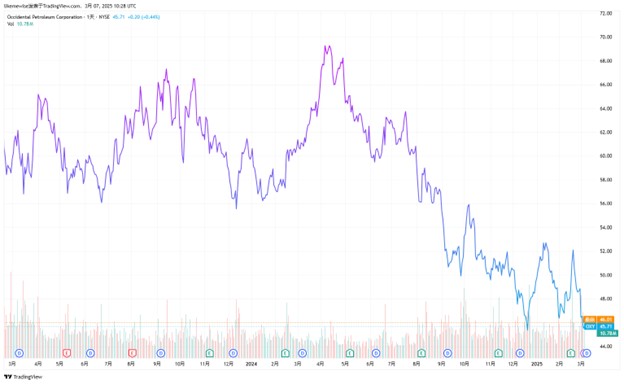
Source: TradingView
Key Points
- The acquisition of CrownRock significantly enhances asset quality and business prospects of Occidental Petroleum.
- The company has launched an asset divestiture plan to de - leverage. The growth in high - quality oil and gas production generates cash flow for debt repayment and dividend growth.
- The OXY share still has a 15% potential upside even if oil prices remain flat in 2025.
Overview
TradingKey - Occidental Petroleum Corporation (OXY.N) was founded in 1920 and is headquartered in Houston, Texas, USA. It is one of the top five largest oil and gas company in the United States. The company's businesses cover oil and gas exploration and production (upstream), chemical product manufacturing (midstream), and carbon capture and storage (low-carbon business). Occidental Petroleum is renowned for its leading position in the Permian Basin and innovation in low carbon technologies. In 2020, the company acquired Anadarko Petroleum for $38 billion, significantly boosting its production in the Permian Basin.
In 2024, the company's global proven reserves reached 4.6 billion barrels of oil equivalent, and its net oil and gas production hit a new high, reaching 1.327 million barrels of oil equivalent per day. The growth in production was mainly driven by its domestic oil and gas assets in areas such as the Permian Basin and the Rocky Mountains. Meanwhile, its low-carbon businesses, such as carbon capture and storage, also made remarkable progress. On June 4, 2024, Occidental Petroleum and BHE Renewables, a wholly - owned subsidiary of Berkshire Hathaway Energy, announced the establishment of a joint venture to demonstrate and deploy direct lithium extraction (DLE) and its related technologies.
Revenue Sources
The company's operations are mainly carried out through three main divisions: upstream, chemical, midstream and marketing.
1) Upstream Business: Primarily responsible for the exploration and production of crude oil and natural gas. In 2024, the revenue from the oil and gas business was $21.7 billion, a 2% YoY increase. This growth was mainly due to increased production in the Permian Basin in the United States and the Middle East.
2) Chemical Business: Covers the production and trade of petroleum products. In 2024, the revenue of the chemicals segment were $4.92 billion, a 7.5% YoY decrease. The company stated that due to capacity growth outpacing demand growth, the refining margin declined from the previous year's historical high.
3) Marketing and Logistics Business: Encompasses the procurement, marketing, collection, processing, transportation, and storage of oil, condensate, natural gas, carbon dioxide, and electricity. In 2024, the marketing and logistics segment generated nearly $96 million in revenue. Affected by the slowdown in economic activities and the pressure of energy transition, the revenue decline was relatively significant.
Period Ending | 31-Dec-24 | 30-Sep-24 | 30-Jun-24 | 31-Mar-24 | 31-Dec-23 | 30-Sep-23 | 30-Jun-23 | 31-Mar-23 |
Oil and Gas | 21.71B | 21.51B | 21.40B | 20.87B | 21.28B | 22.16B | 23.66B | 26.42B |
Oil and Gas Growth | 1.98% | -2.94% | -9.54% | -20.98% | -21.65% | -16.98% | -3.60% | 23.71% |
Chemical | 4.92B | 4.94B | 5.00B | 5.10B | 5.32B | 5.56B | 5.94B | 6.48B |
Chemical Growth | -7.48% | -11.22% | -15.86% | -21.24% | -21.25% | -18.91% | -9.45% | 10.89% |
Midstream and Marketing | 962.00M | 1.45B | 1.57B | 1.90B | 2.55B | 2.69B | 3.15B | 4.01B |
Midstream and Marketing Growth | -62.29% | -46.07% | -50.27% | -52.58% | -38.32% | -36.13% | -19.62% | 36.32% |
Source: TradingKey, SEC Filings
Outlook for Crude Oil
In early March 2025, the voluntary production-cut countries within OPEC+ issued a joint statement, reaffirming that they would gradually withdraw from the voluntary production cut of 2.2 million barrels per day starting from April, and would submit a compensatory production plan. Against the backdrop of moderate growth in global oil demand and stable supply from non-OPEC countries, we expect that the actual production of OPEC+ will increase starting from the second quarter, and there is a strong expectation of inventory accumulated, making it difficult for oil prices to have a significant rebound.
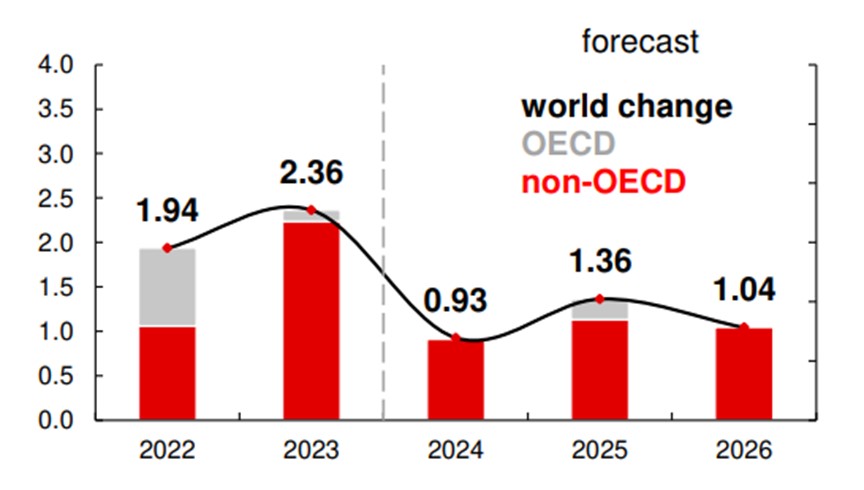
Source: TradingKey, EIA
From medium-term perspective, with China’s economic policy stimulus and India’s demand recovery, crude demand may rebound, with incremental growth reaching about 1.36 million bpd. OPEC+ annual average production is projected to increase slightly, resulting in a slight global supply surplus of ~100 thousand bpd. Sanctions on countries like Russia, Iran, and Venezuela could significantly reduce their supply. Overall, the 2025 Brent oil price is expected to trade in the range of $65–$80/barrel.
Does OXY Still Hold Investment Potential?
In the global economic headwinds and energy market volatility, investors are approaching the long-term prospects of the oil industry with caution. However, Occidental stands out with its strategic asset acquisitions, capital expenditures, and cash return enhancements, to retain its competitiveness and creates value for investors.
1) CrownRock Acquisition Enhances Asset Quality
The core producing areas of Occidental are the Permian Basin (mainly in the Midland and Delaware Basins), the DJ Basin, and the U.S. Gulf. The international assets are relatively few and are mainly concentrated in the Middle East and North Africa regions. Most of the net present value (NPV) of Occidental Petroleum still comes from its shale oil and gas business. Most investors believe that the shale business has entered a mature stage and is currently in the cash flow return phase, and U.S. oil production is likely to peak in about 15 years before starting to decline.
Before the acquisition of CrownRock, Occidental 's drilling plan and top inventory (with a break-even point of less than $40) were mainly focused on the Delaware Basin. In contrast, Exxon Mobile's shale oil operations typically have costs hovering around $45 per barrel. The cumulative oil production of its wells is higher than that of most of its peers, and it is more than 30% higher than the industry average. It can achieve efficient occupation with a smaller number of wells drilled and can achieve low-risk development with cost control by using less proppant during the mining process.
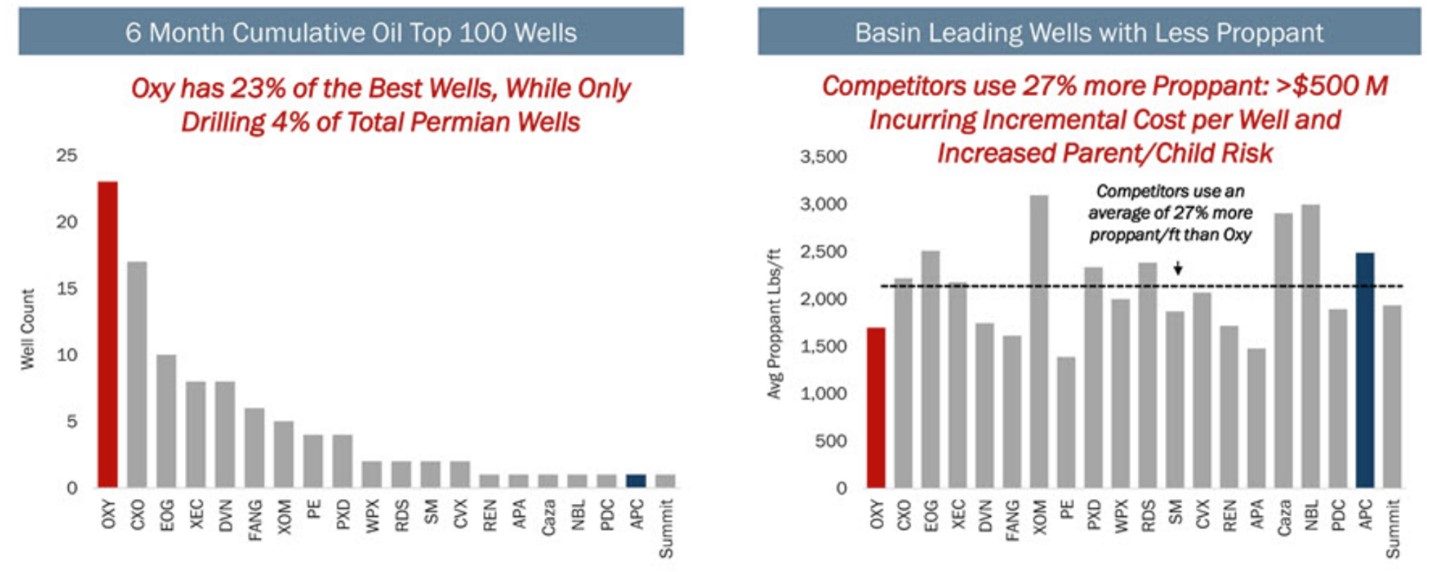
Source: OXY
The company plans to strengthen its asset scale in the Midland Basin, increasing the production of high-margin oil and gas. The acquisition of CrownRock has completely changed the prospects of OXY's business in Midland. This transaction has increased the high-margin production by 170 thousand barrels of oil equivalent per day, brought in the best-performing wells in the basin, and doubled the proportion of its top Midland asset, significantly increasing its proportion. This will further reduce the cost per well and shorten the production cycle. After the integration is completed, there may eventually be only 10 large oil companies left in North America, and Occidental is one of them.
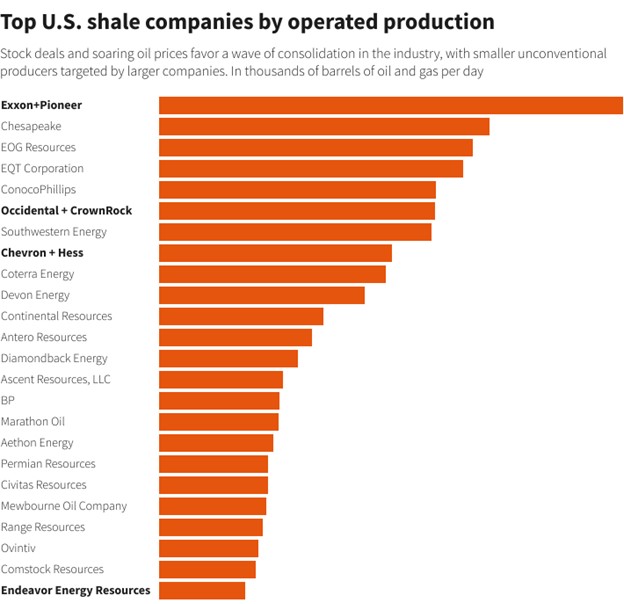
Source: Rystad Energy
2) Capital Expenditure Tilts towards Oil and Gas
OXY's capital expenditure strategy places greater emphasis on high-return shale oil projects. The company expects the total capital expenditure for the whole year of 2025 to be approximately $7.6 billion, an increase of 12% YoY, slightly higher than the global upstream capital expenditure growth rate estimated by the IEA. The capital expenditure in the oil and gas sector is accounting for 72%. It is mainly used for the shale oil and gas sector after the acquisition of CrownRock's assets. The high return rate and rapid cash flow recovery ability of the oil and gas business will provide the company with more stable cash flow to support the company's continued increase in dividends and share repurchase plans.
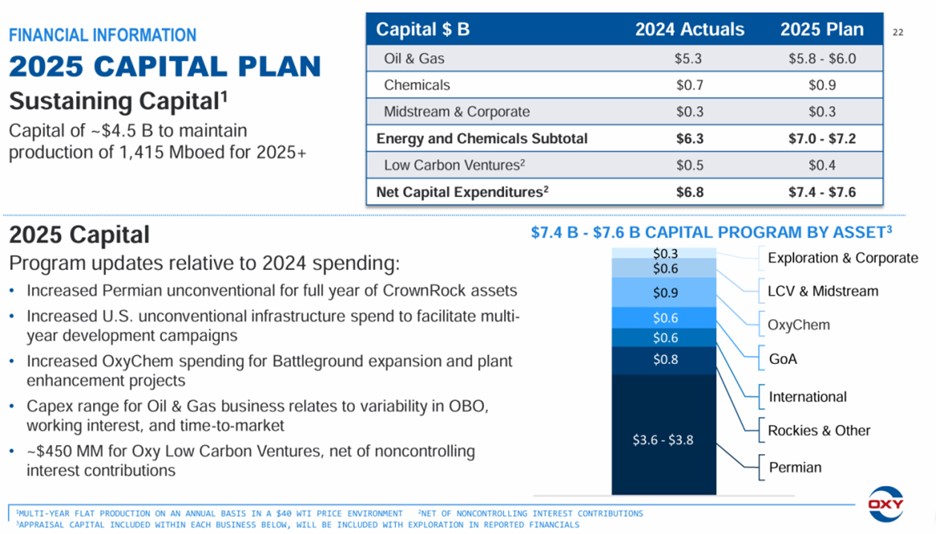
Source: OXY
The capital expenditure in the low-carbon investment sector is about $400 million, accounting for only 8%, a decrease of $100 million YoY. This is mainly because after evaluating the market demand for low-carbon businesses, the company has decided to concentrate funds on projects with greater return potential.
3) Deleveraging to Enhance Cash Returns
When Occidental acquired CrownRock, it not only assumed the existing debt of $1.2 billion but also borrowed an additional $9 billion to achieve rapid integration. This will bring OXY's long-term debt to approximately $24.3 billion by the end of 2024, and the debt ratio will rise to 60% in the short term, significantly increasing the long-term debt pressure. Therefore, the company has launched an asset divestiture plan worth aiming to reduce debt by selling non-core assets.
After the acquisition is completed, the cash flow generated by the growth of high-quality oil and gas production will fund short-term dividend growth and debt repayment. The management is committed to deleveraging and plans to implement the divestiture plan with the goal of controlling long-term liabilities below $15 billion to resume share repurchases, increase dividends, etc. We expect that in the next two years, $4.5 billion of debt can be repaid respectively through asset sales. Therefore, under the assumption of an oil price of $70 per barrel, its free cash flow will reach $5 per share until 2026, but this will also restore Occidental 's financial level in 2022.
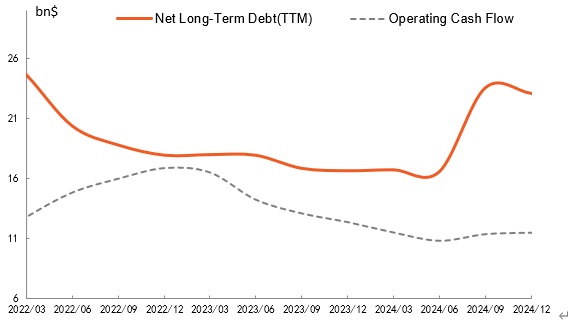
Source: Refinitiv
Financials and Valuation
Judging from the financial report performance in Q4 2024, OXY's revenue was basically flat, but the adjusted earnings per share (EPS) exceeded expectations. The annual revenue decreased only 1.8%, which reflected the drag on revenue caused by the decline in oil prices. The EPS exceeded expectations (a YoY increase of 3.8%) indicated a decrease in the cash cost. The company's annual production continued to increase quarter by quarter and it offset part of the price pressure through the improvement of operational efficiency.
The management emphasized that they will maintain the strategy of "balancing production growth and cash flow" . The production guidance for 2025 shows a growth rate of 5-9%. More than 78% of the capital expenditure will be concentrated on oil and gas development. It plans to sell $1.2 billion of non-core assets in Q1 for debt repayment. Considering the current risk of oil price fluctuations, OXY needs to pay a considerable amount of free cash flow and increase the dividend yield to 4-5% to be attractive, which is also the level of its large-cap peers in the upstream sector in the United States. Otherwise, OXY will not provide sufficient defensiveness in the face of the downward cycle of oil prices.
In the long term, we believe that this stock ultimately has significant value. Based on their reserves in the Permian Basin and using the Net Asset Value (NAV) model for valuation, we assume that the Brent price will be around $75 per barrel in the long term. Then the enterprise value of the oil, gas and chemical business is $89 per share. After deducting debt, deferred equity, and changes in working capital, the theoretical value per share is $54. Compared with the current market trading price ($46 per share), there is a potential upside of 15% in 2025.
Company Name | Occidental | Suncor Energy Inc. | Equinor ASA | Exxon Mobil Corporation | Chevron Corporation | Shell plc |
Ticker | OXY | SU | EQNR | XOM | CVX | SHEL |
P/E (FWD) | 13.25 | 12.21 | 6.95 | 14.92 | 14.74 | 8.42 |
P/E (TTM) | 20.26 | 10.59 | 7.17 | 13.73 | 15.74 | 12.89 |
PEG (FWD) | 0.97 | 0.8 | 0.53 | 1.79 | 1.46 | 0.86 |
Price/Sales (TTM) | 1.56 | 1.26 | 0.61 | 1.36 | 1.42 | 0.72 |
EV/Sales (FWD) | 2.75 | 1.48 | 0.67 | 1.47 | 1.49 | 0.86 |
EV/Sales (TTM) | 2.86 | 1.45 | 0.66 | 1.47 | 1.5 | 0.85 |
EV/EBITDA (FWD) | 5.16 | 4.59 | 1.65 | 6.76 | 6.22 | 4.02 |
EV/EBITDA (TTM) | 5.9 | 4.49 | 1.71 | 7.76 | 7.31 | 4.11 |
Price to Book (TTM) | 1.66 | 1.4 | 1.44 | 1.78 | 1.78 | 1.12 |
Price/Cash Flow (TTM) | 3.75 | 3.87 | 3.01 | 8.49 | 8.55 | 3.65 |
Source: Refinitiv