

Novo Nordisk A/S
NVOToday
+9.92%
5 Days
-19.84%
1 Month
-15.32%
6 Months
+4.98%
Year to Date
-6.37%
1 Year
-45.35%
TradingKey Stock Score of Novo Nordisk A/S
Currency: USD Updated: 2026-02-06Key Insights
Novo Nordisk A/S's fundamentals are relatively healthy, with an industry-leading ESG disclosure.and its growth potential is high.Its valuation is considered fairly valued, ranking 77 out of 159 in the Pharmaceuticals industry.Institutional ownership is very high.Over the past month, multiple analysts have rated it as Hold, with the highest price target at 57.79.In the medium term, the stock price is expected to remain stable.Despite a very weak market performance over the past month, the company shows strong fundamentals and technicals.The stock price is trading sideways between the support and resistance levels, making it suitable for range-bound swing trading.
Novo Nordisk A/S's Score
Support & Resistance
Score Analysis
Media Coverage
Novo Nordisk A/S Highlights
Novo Nordisk A/S is a Danish multinational pharmaceutical firm headquartered in Bagsværd, with manufacturing facilities across nine countries and affiliates or offices in five others. The company is predominantly controlled by its majority shareholder, Novo Holdings A/S, which owns approximately 28.1% of its shares and a majority of its voting rights.
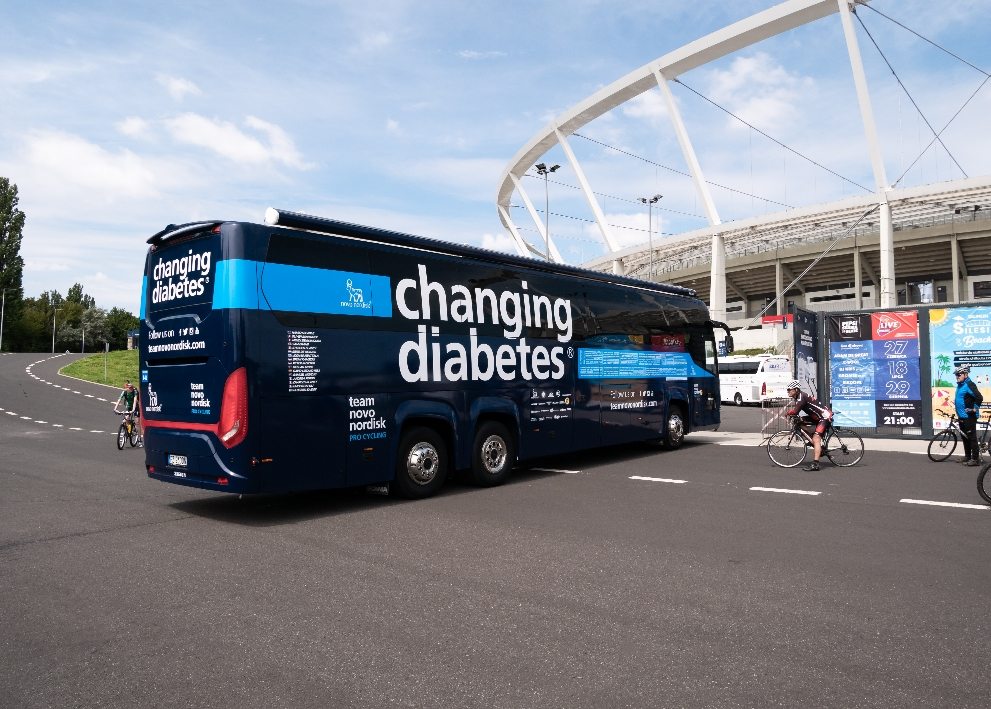
Novo Nordisk specializes in the production and marketing of pharmaceutical products and services, focusing primarily on diabetes care medications and devices. Among its key products is semaglutide, utilized for diabetes treatment under the brand names Ozempic and Rybelsus, as well as for obesity treatment under the brand name Wegovy. The company also engages in hemostasis management, growth hormone therapy, and hormone replacement therapy, producing numerous drugs under various brand names such as Levemir, Tresiba, NovoLog, Novolin R, NovoSeven, NovoEight, and Victoza.
Employing over 48,000 individuals worldwide, Novo Nordisk distributes its products in 168 countries. The corporation was formed in 1989 from a merger of two Danish companies with origins tracing back to the 1920s. The Novo Nordisk logo features the Apis bull, a sacred animal from ancient Egypt, represented by the hieroglyph 𓃒. Novo Nordisk is also a full member of the European Federation of Pharmaceutical Industries and Associations.
Recognized for its workplace culture, the company was ranked 25th among Fortune's 100 Best Companies to Work For in 2010, later ranking 72nd in 2014 and 73rd in 2017. In January 2012, Novo Nordisk was acclaimed as the most sustainable company globally by Corporate Knights, while its spin-off, Novozymes, secured the fourth position. The company is a leader in the FTSE4Good Index and stands as the only European firm in the top ten list. As the largest pharmaceutical company in Denmark, Novo Nordisk's market capitalization surpassed the GDP of Denmark's domestic economy in 2023, making it the highest valued company in Europe, with net sales reaching US$42.121 billion in 2024.
Analyst Rating
Novo Nordisk A/S News
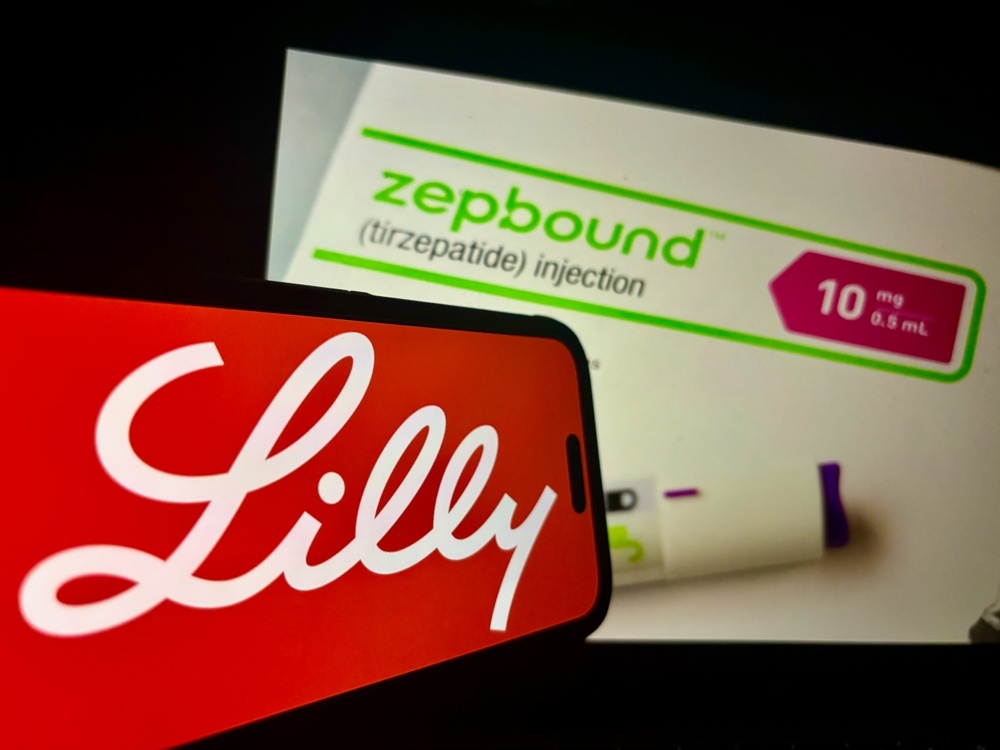
What to Expect From Eli Lilly in 2026? Is LLY Stock a Good Buy Now?
The company’s main goal and focus in 2026 will be to maintain its leadership position in weight management, whilst expanding further into additional therapeutic areas, so that revenue growth will not be dependent on a singular product. It is expected that Eli Lilly’s stocks will serve as a predictor
Novo Nordisk 2026: Will the Ozempic Makers Benefit From the Strong Demand for Oral Wegovy?
Who owns Ozempic? Novo Nordisk (NVO) does, and that simple fact places the firm at the heart of the global discussion around GLP-1 drugs. But the story today for the market is another one.
Novo Nordisk’s First Oral Weight-Loss Drug Wins FDA Approval — How Long Can Eli Lilly Hold Its Lead?
TradingKey - On Monday, December 22, The U.S. Food and Drug Administration (FDA) officially approved the oral tablet version of Novo Nordisk's Wegovy injection, making it the world's first approved oral GLP-1 weight-loss medication.
Novo Nordisk (NVO) : From Market Darling to Selloff Target — Should You Buy the Dip?
TradingKey - We've recently observed that,Novo Nordisk A/S, impacted by intensifying competition in weight-loss drugs (such as from U.S.Eli Lilly and Company) and weaker-than-expected earnings reports, has seen its stock price continually decline, falling over 70% from its peak of 143.54.
Eli Lilly vs. Novo Nordisk: Why Lilly Is Better Positioned Under Trump's Drug Pricing Pressure
TradingKey - Eli Lilly and Novo Nordisk, the two dominant players in the US weight-loss drug market, are experiencing vastly different investor sentiment despite facing unprecedented GLP-1 drug price cuts under the Trump administration's price cut initiative.
“Trump’s Pharmacy” Cutting Weight-Loss Drug Prices — What This Means for Novo and Lilly
TradingKey - Following agreements with Pfizer and AstraZeneca, the so-called “twin giants” of weight-loss drugs — Novo Nordisk and Eli Lilly — have now also reached pricing deals with the Trump administration. This marks the latest move in Trump’s broader push to cut U.S. drug prices by up to 90%

Financial Indicators
EPS
Total revenue
Novo Nordisk A/S Info
Novo Nordisk A/S is a Danish multinational pharmaceutical firm headquartered in Bagsværd, with manufacturing facilities across nine countries and affiliates or offices in five others. The company is predominantly controlled by its majority shareholder, Novo Holdings A/S, which owns approximately 28.1% of its shares and a majority of its voting rights.
Novo Nordisk specializes in the production and marketing of pharmaceutical products and services, focusing primarily on diabetes care medications and devices. Among its key products is semaglutide, utilized for diabetes treatment under the brand names Ozempic and Rybelsus, as well as for obesity treatment under the brand name Wegovy. The company also engages in hemostasis management, growth hormone therapy, and hormone replacement therapy, producing numerous drugs under various brand names such as Levemir, Tresiba, NovoLog, Novolin R, NovoSeven, NovoEight, and Victoza.
Employing over 48,000 individuals worldwide, Novo Nordisk distributes its products in 168 countries. The corporation was formed in 1989 from a merger of two Danish companies with origins tracing back to the 1920s. The Novo Nordisk logo features the Apis bull, a sacred animal from ancient Egypt, represented by the hieroglyph 𓃒. Novo Nordisk is also a full member of the European Federation of Pharmaceutical Industries and Associations.
Recognized for its workplace culture, the company was ranked 25th among Fortune's 100 Best Companies to Work For in 2010, later ranking 72nd in 2014 and 73rd in 2017. In January 2012, Novo Nordisk was acclaimed as the most sustainable company globally by Corporate Knights, while its spin-off, Novozymes, secured the fourth position. The company is a leader in the FTSE4Good Index and stands as the only European firm in the top ten list. As the largest pharmaceutical company in Denmark, Novo Nordisk's market capitalization surpassed the GDP of Denmark's domestic economy in 2023, making it the highest valued company in Europe, with net sales reaching US$42.121 billion in 2024.
Related Instruments
Popular Symbols
