Bristol-Myers Squibb Co's fundamentals are relatively healthy, with an industry-leading ESG disclosure.and its growth potential is high.Its valuation is considered fairly valued, ranking 14 out of 159 in the Pharmaceuticals industry.Institutional ownership is very high.Over the past month, multiple analysts have rated it as Hold, with the highest price target at 58.40.In the medium term, the stock price is expected to trend up.The company has been performing well in the stock market over the past month, which is supported by its strong fundamentals and technicals.The stock price is trading sideways between the support and resistance levels, making it suitable for range-bound swing trading.
Bristol-Myers Squibb Co's Score
Industry at a Glance
Industry Ranking
14 / 159
Overall Ranking
41 / 4521
Industry
Pharmaceuticals
Support & Resistance
Relevant data have not been disclosed by the company yet.
Score Analysis
Current score
Previous score
Media Coverage
Last 24 hours
Coverage Level
Very Low
Very High
Negative
Bristol-Myers Squibb Co Highlights
StrengthsRisks
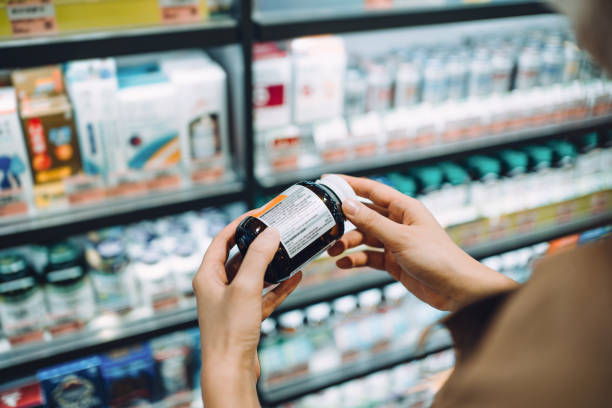
Bristol-Myers Squibb Company is a global biopharmaceutical company. It is engaged in the discovery, development and delivery of transformational medicines for patients facing serious diseases in areas: oncology, hematology, immunology, cardiovascular, neuroscience and other areas. Its growth portfolio includes Opdivo (nivolumab), Opdivo Qvantig (nivolumab and hyaluronidase-nvhy), Yervoy (ipilimumab), Reblozyl (luspatercept-aamt), Opdualag (nivolumab and relatlimab-rmbw), Breyanzi (lisocabtagene maraleucel), Camzyos (mavacamten), Zeposia (ozanimod), Abecma (idecabtagene vicleucel), and Sotyktu (deucravacitinib). Its other growth products include Onureg, Inrebic, and Empliciti. Its legacy portfolio includes Eliquis (apixaban), Revlimid (lenalidomide), Pomalyst/Imnovid (pomalidomide), Sprycel (dasatinib), and Abraxane (paclitaxel albumin-bound particles for injectable suspension). Opdivo (nivolumab) is a fully human monoclonal antibody that binds to the PD-1 on T and NKT cells.
Turnaround to Profit
The company's performance has turned profitable, with the latest annual net income of USD .
Fairly Valued
The company’s latest PE is 17.87, at a medium 3-year percentile range.
Institutional Selling
The latest institutional holdings are 1.68B shares, decreasing 0.01% quarter-over-quarter.
Bristol-Myers Squibb Company is a global biopharmaceutical company. It is engaged in the discovery, development and delivery of transformational medicines for patients facing serious diseases in areas: oncology, hematology, immunology, cardiovascular, neuroscience and other areas. Its growth portfolio includes Opdivo (nivolumab), Opdivo Qvantig (nivolumab and hyaluronidase-nvhy), Yervoy (ipilimumab), Reblozyl (luspatercept-aamt), Opdualag (nivolumab and relatlimab-rmbw), Breyanzi (lisocabtagene maraleucel), Camzyos (mavacamten), Zeposia (ozanimod), Abecma (idecabtagene vicleucel), and Sotyktu (deucravacitinib). Its other growth products include Onureg, Inrebic, and Empliciti. Its legacy portfolio includes Eliquis (apixaban), Revlimid (lenalidomide), Pomalyst/Imnovid (pomalidomide), Sprycel (dasatinib), and Abraxane (paclitaxel albumin-bound particles for injectable suspension). Opdivo (nivolumab) is a fully human monoclonal antibody that binds to the PD-1 on T and NKT cells.