

Morgan Stanley
MSToday
+2.34%
5 Days
-1.55%
1 Month
-4.15%
6 Months
+27.36%
Year to Date
+1.37%
1 Year
+27.56%
TradingKey Stock Score of Morgan Stanley
Currency: USD Updated: 2026-02-06Key Insights
Morgan Stanley's fundamentals are relatively healthy, with an industry-leading ESG disclosure.and its growth potential is high.Its valuation is considered fairly valued, ranking 55 out of 118 in the Investment Banking & Investment Services industry.Institutional ownership is very high.Over the past month, multiple analysts have rated it as Buy, with the highest price target at 196.58.In the medium term, the stock price is expected to remain stable.Despite an average stock market performance over the past month, the company shows strong technicals.The stock price is trading sideways between the support and resistance levels, making it suitable for range-bound swing trading.
Morgan Stanley's Score
Support & Resistance
Score Analysis
Media Coverage
Morgan Stanley Highlights
Analyst Rating
Morgan Stanley News
‘Rate Cuts and QT’? Warsh Sparks Controversy, Wall Street Asks Again: Is He a Hawk or a Dove
TradingKey - Since Donald Trump announced his nomination of former Federal Reserve Governor Kevin Warsh as the next Fed Chair, market expectations for the future path of monetary policy have shifted rapidly. As a candidate known for his opposition to quantitative easing (QE), Warsh’s policy stance has drawn significant investor attention and reignited market debate over whether the Federal Reserve will pivot to a more hawkish position.

Bank Earnings Lead 2026 Market Charge, but Wall Street Eyes Guidance as Key
Wall Street analysts noted that compared to this quarter’s results, the upcoming earnings guidance and the confirmation of signals for further recovery in the capital markets are of greater importance.

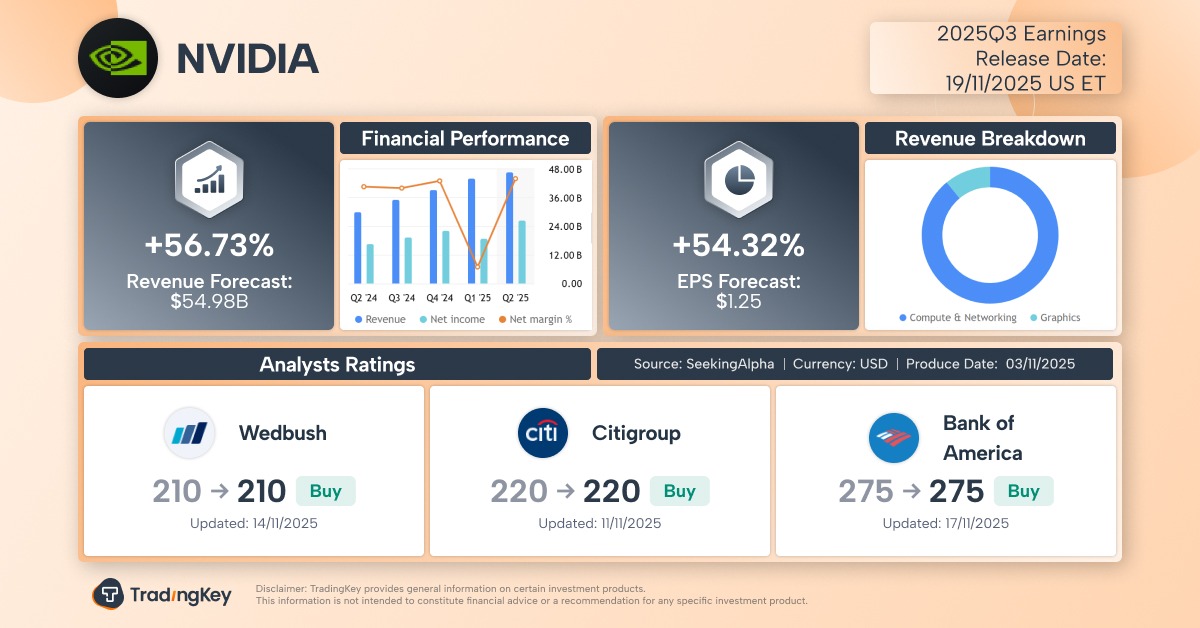
Nvidia Q3 Earnings Preview: Can Blackwell's Ramp-Up Break the Slowdown and Save the U.S. Stocks?
TradingKey - NVIDIA (NVDA) is set to report its Q3 FY2026 earnings after market close on Wednesday, November 19, positioning itself as a key market focus amid a broader U.S. stock market pullback fueled by AI bubble concerns and liquidity pressures. Analysts widely anticipate NVIDIA will deliver its
U.S. Banks Q3 Earnings Preview: Big 5 Banks See Double-Digit EPS Growth, Investment Banking Hits 4-Year High
TradingKey - The 2025 U.S. earnings season kicks off this week with results from major banks. Amid elevated investor sentiment and the Trump administration pushing for deregulation, analysts expect another strong quarter for the banking sector — driven by booming trading activity and a resurgence

Q2 2025 Earnings Season Preview: The First Test Under Trump’s Tariffs — Could Low Expectations Bring Surprises?
TradingKey - Mid-July will mark the first earnings season since President Donald Trump’s tariff policy took effect, offering investors a glimpse into how American companies are handling the impact of trade tensions. Analysts believe that with low expectations heading into Q2, it may be easier for

Q1 2025 Market Forecast: What Bank Results Indicate About the Direction of the Stock Market
TradingKey - As the first quarter of 2025 is wrapping up, investors are piecing together a more detailed view of the next direction of the stock market.

Financial Indicators
EPS
Total revenue
Morgan Stanley Info
Related Instruments
Popular Symbols
