

Bank of America Corp
BACToday
+2.89%
5 Days
+6.26%
1 Month
-1.26%
6 Months
+24.46%
Year to Date
+2.78%
1 Year
+18.41%
TradingKey Stock Score of Bank of America Corp
Currency: USD Updated: 2026-02-06Key Insights
Bank of America Corp's fundamentals are relatively healthy, with an industry-leading ESG disclosure.and its growth potential is high.Its valuation is considered fairly valued, ranking 28 out of 397 in the Banking Services industry.Institutional ownership is very high.Over the past month, multiple analysts have rated it as Buy, with the highest price target at 60.83.In the medium term, the stock price is expected to remain stable.Despite an average stock market performance over the past month, the company shows strong fundamentals and technicals.The stock price is trading sideways between the support and resistance levels, making it suitable for range-bound swing trading.
Bank of America Corp's Score
Support & Resistance
Score Analysis
Media Coverage
Bank of America Corp Highlights
The Bank of America Corporation is an American multinational investment bank and financial services holding entity headquartered at the Bank of America Corporate Center in Charlotte, North Carolina, with additional investment banking and supporting headquarters located in Manhattan. The bank was established through the merger of NationsBank and Bank of America in 1998. It stands as the second-largest banking institution in the United States and the second-largest bank globally by market capitalization, following JPMorgan Chase. Bank of America is recognized as one of the Big Four banking institutions in the United States and one of eight systemically important financial institutions within the country. The bank serves approximately 10 percent of all American bank deposits, directly competing with JPMorgan Chase, Citigroup, and Wells Fargo. Its principal financial operations encompass commercial banking, wealth management, and investment banking. The historical roots of Bank of America can be traced back to 1784 when Massachusetts Bank was chartered, marking it as the first federally chartered joint-stock owned bank in the U.S. Additionally, another branch of its heritage dates to the U.S.-based Bank of Italy, founded by Amadeo Pietro Giannini in 1904, which provided essential banking services to Italian immigrants facing service discrimination. Headquartered in San Francisco, California, Giannini acquired Banca d'America e d'Italia in 1922 and ultimately operated as Bank of America.
In the 1950s, pivotal federal banking legislation facilitated swift growth, rapidly establishing significant market shares for the bank's predecessors. Following considerable losses during the 1998 Russian financial crisis, BankAmerica, as it was then known, was acquired by NationsBank of Charlotte for $62 billion. This acquisition was notable as the largest bank acquisition in history at that time, leading to the establishment of the Bank of America Corporation. Through a sequence of mergers and acquisitions, it expanded its commercial banking operations, launching Merrill Lynch for wealth management and Bank of America Merrill Lynch for investment banking in 2008 and 2009, respectively, which has since been rebranded as BofA Securities.
Both Bank of America and Merrill Lynch Wealth Management maintain substantial market shares in their respective sectors. The investment bank is classified within the "Bulge Bracket," recognized as the third-largest investment bank globally as of 2018. Its wealth management division oversees $1.08 trillion in assets under management, positioning it as the second-largest wealth manager worldwide, surpassed only by UBS. In the realm of commercial banking, while Bank of America has operations, it does not necessarily operate retail branches in all 50 states of the United States, Washington, D.C., and over 40 other countries. Its commercial banking operations encompass 46 million consumer and small business relationships across 4,600 banking centers and 16,000 automated teller machines.
The substantial market share, business operations, and economic influence of the bank have led to numerous lawsuits and regulatory investigations concerning mortgages and financial disclosures dating back to the 2008 financial crisis. The corporate practices of Bank of America, which focus on servicing the middle class and the broader banking community, have resulted in a considerable market share since the early 20th century. As of August 2018, Bank of America boasts a market capitalization of $313.5 billion, making it the 13th largest company in the world. Being the sixth-largest American public company, it reported $102.98 billion in sales as of June 2018. Bank of America was ranked No. 25 on the 2020 Fortune 500 list of the largest U.S. corporations by total revenue and further secured the No. 6 position on Forbes' 2023 Global 2000 rankings. The bank was awarded the title of "World's Best Bank" by the Euromoney Institutional Investor in its 2018 Awards for Excellence.
Analyst Rating
Bank of America Corp News
Gold Hits $5,000, Silver Soars Past $100, Who Is Behind the ‘Buying Frenzy’?
TradingKey — In early Monday trading, spot gold historically breached the $5,000 per ounce mark, an achievement coming just over three months after prices first surpassed $4,000 on October 8, 2025. During the same period, spot silver also rallied strongly to reach a new high of $107 per ounce.

Bank Earnings Lead 2026 Market Charge, but Wall Street Eyes Guidance as Key
Wall Street analysts noted that compared to this quarter’s results, the upcoming earnings guidance and the confirmation of signals for further recovery in the capital markets are of greater importance.

U.S. Banks Q3 Earnings Preview: Big 5 Banks See Double-Digit EPS Growth, Investment Banking Hits 4-Year High
TradingKey - The 2025 U.S. earnings season kicks off this week with results from major banks. Amid elevated investor sentiment and the Trump administration pushing for deregulation, analysts expect another strong quarter for the banking sector — driven by booming trading activity and a resurgence

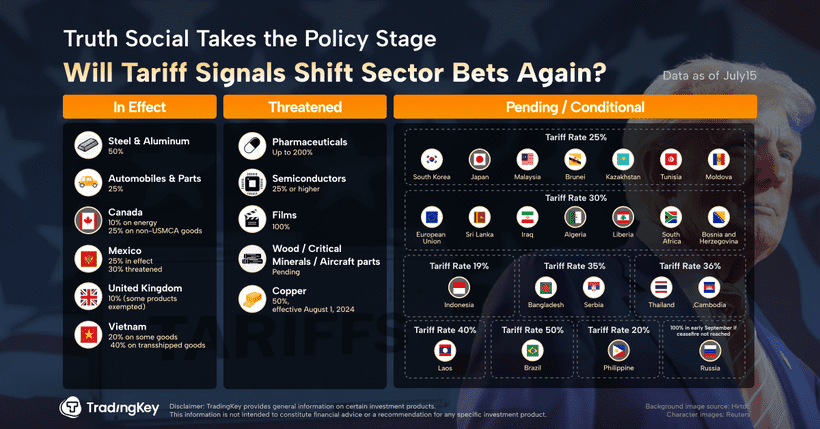
Is Now the Time to Invest in U.S. Stocks Amid Renewed Tariff Uncertainty?
TradingKey - On July 7, President Donald Trump posted letters addressed to 14 world leaders outlining his updated tariff strategy.
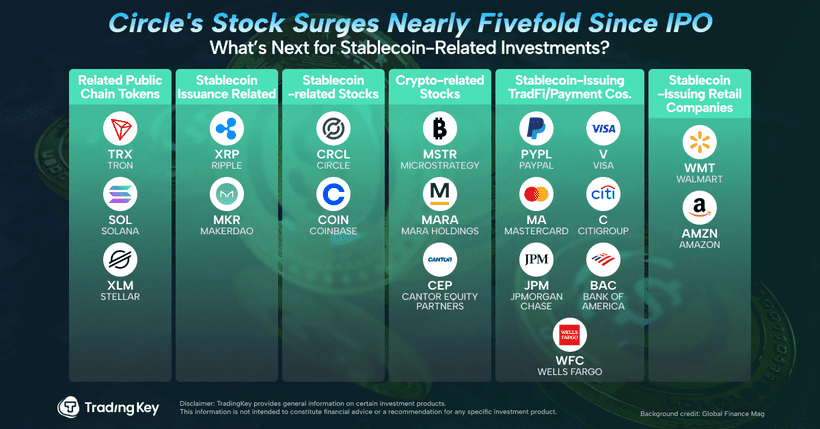
Circle Rallies 34% on GENIUS Act Tailwinds — What’s Next for Stablecoin Investors?
TradingKey - In a major milestone for crypto regulation, the U.S. Senate on Tuesday passed the GENIUS Act — a landmark bill that lays the groundwork for federal oversight of U.S. dollar-pegged stablecoins.
Warren Buffett’s 2025 Portfolio: A Defensive Giant Balancing Legacy Bets with Strategic Discipline
TradingKey - As of March 31, 2025, Warren Buffett’s Berkshire Hathaway holds a $258.7 billion equity portfolio spread across 36 stocks. The Oracle of Omaha hasn’t made a new buy this quarter, and turnover remains minimal at 1%.

Financial Indicators
EPS
Total revenue
Bank of America Corp Info
The Bank of America Corporation is an American multinational investment bank and financial services holding entity headquartered at the Bank of America Corporate Center in Charlotte, North Carolina, with additional investment banking and supporting headquarters located in Manhattan. The bank was established through the merger of NationsBank and Bank of America in 1998. It stands as the second-largest banking institution in the United States and the second-largest bank globally by market capitalization, following JPMorgan Chase. Bank of America is recognized as one of the Big Four banking institutions in the United States and one of eight systemically important financial institutions within the country. The bank serves approximately 10 percent of all American bank deposits, directly competing with JPMorgan Chase, Citigroup, and Wells Fargo. Its principal financial operations encompass commercial banking, wealth management, and investment banking. The historical roots of Bank of America can be traced back to 1784 when Massachusetts Bank was chartered, marking it as the first federally chartered joint-stock owned bank in the U.S. Additionally, another branch of its heritage dates to the U.S.-based Bank of Italy, founded by Amadeo Pietro Giannini in 1904, which provided essential banking services to Italian immigrants facing service discrimination. Headquartered in San Francisco, California, Giannini acquired Banca d'America e d'Italia in 1922 and ultimately operated as Bank of America.
In the 1950s, pivotal federal banking legislation facilitated swift growth, rapidly establishing significant market shares for the bank's predecessors. Following considerable losses during the 1998 Russian financial crisis, BankAmerica, as it was then known, was acquired by NationsBank of Charlotte for $62 billion. This acquisition was notable as the largest bank acquisition in history at that time, leading to the establishment of the Bank of America Corporation. Through a sequence of mergers and acquisitions, it expanded its commercial banking operations, launching Merrill Lynch for wealth management and Bank of America Merrill Lynch for investment banking in 2008 and 2009, respectively, which has since been rebranded as BofA Securities.
Both Bank of America and Merrill Lynch Wealth Management maintain substantial market shares in their respective sectors. The investment bank is classified within the "Bulge Bracket," recognized as the third-largest investment bank globally as of 2018. Its wealth management division oversees $1.08 trillion in assets under management, positioning it as the second-largest wealth manager worldwide, surpassed only by UBS. In the realm of commercial banking, while Bank of America has operations, it does not necessarily operate retail branches in all 50 states of the United States, Washington, D.C., and over 40 other countries. Its commercial banking operations encompass 46 million consumer and small business relationships across 4,600 banking centers and 16,000 automated teller machines.
The substantial market share, business operations, and economic influence of the bank have led to numerous lawsuits and regulatory investigations concerning mortgages and financial disclosures dating back to the 2008 financial crisis. The corporate practices of Bank of America, which focus on servicing the middle class and the broader banking community, have resulted in a considerable market share since the early 20th century. As of August 2018, Bank of America boasts a market capitalization of $313.5 billion, making it the 13th largest company in the world. Being the sixth-largest American public company, it reported $102.98 billion in sales as of June 2018. Bank of America was ranked No. 25 on the 2020 Fortune 500 list of the largest U.S. corporations by total revenue and further secured the No. 6 position on Forbes' 2023 Global 2000 rankings. The bank was awarded the title of "World's Best Bank" by the Euromoney Institutional Investor in its 2018 Awards for Excellence.
Related Instruments
Popular Symbols
