

Unitedhealth Group Inc
UNHToday
+2.98%
5 Days
-3.58%
1 Month
-20.72%
6 Months
+12.56%
Year to Date
-16.19%
1 Year
-47.81%
TradingKey Stock Score of Unitedhealth Group Inc
Currency: USD Updated: 2026-02-06Key Insights
Unitedhealth Group Inc's fundamentals are relatively healthy, with an industry-leading ESG disclosure.and its growth potential is significant.Its valuation is considered fairly valued, ranking 60 out of 75 in the Healthcare Providers & Services industry.Institutional ownership is very high.Over the past month, multiple analysts have rated it as Buy, with the highest price target at 366.62.In the medium term, the stock price is expected to trend down.Despite a very weak stock market performance over the past month, the company shows strong technicals.The stock price is trading sideways between the support and resistance levels, making it suitable for range-bound swing trading.
Unitedhealth Group Inc's Score
Support & Resistance
Score Analysis
Media Coverage
Unitedhealth Group Inc Highlights
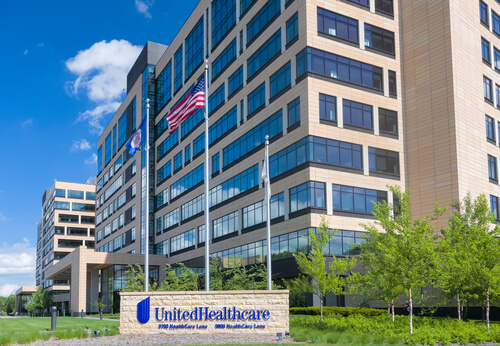
UnitedHealth Group Incorporated is an American multinational for-profit organization that specializes in health insurance and healthcare services, located in Eden Prairie, Minnesota. Operating under the UnitedHealthcare brand for insurance products and the Optum brand for healthcare services, it is recognized as the world's seventh-largest company by revenue and the largest healthcare corporation by revenue. The company ranks 8th on the 2024 Fortune Global 500 list, with a market capitalization of $460.3 billion as of December 20, 2024. UnitedHealth Group has encountered numerous investigations, lawsuits, and penalties—including SEC enforcement related to stock option backdating, Medicare overbilling, unfair claims practices, denials of mental health treatments, and anticompetitive conduct—illuminating deep-rooted issues of fraud, patient harm, and corporate misconduct.
Analyst Rating
Unitedhealth Group Inc News
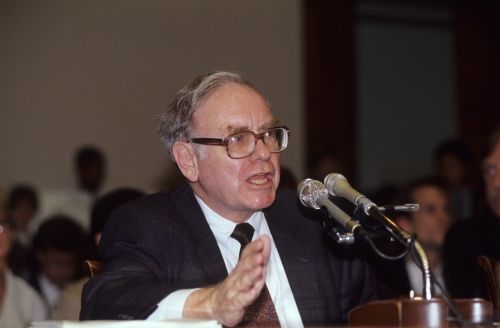
UNH Stock Analysis: UnitedHealth (UNH) Down 50% in 2025 — Buffett Still Holds 45 Million Shares. Time to Buy the Dip?
UnitedHealth Group Stock Analysis: Why has UNH's stock price halved this year? Should investors follow Buffett's lead and continue holding? Will UNH's stock price hit new lows?
US 13F Filings Flood In: 'Smart Money' Shifts Could Deepen Equity Correction
TradingKey - As US tech stocks grapple with AI bubble concerns and faltering performance, quarterly 13F filings from investment institutions are entering a heavy disclosure period. These reports will unveil "smart money" strategies and could influence future market direction. However, given recent

As Rotation from Tech to Value Gains Steam, Is It Time to Buy the Dow Jones by End-2025?
TradingKey - The Dow Jones Industrial Average has reached successive record highs, and its outperformance against the Nasdaq over the past two days reached the highest level in nine months, signaling an early market style shift from tech to blue-chip or value stocks amid persistent concerns about
Why UnitedHealth Stock Dipped Today After Bumping Higher Monday
Key PointsOne pundit tracking the stock became less bullish on its future.He knocked down his price target by 37%.10 stocks we like better than UnitedHealth Group › What the stock analysis community giveth, it can also taketh away.That was the dynamic behind the slide of UnitedHealth Group...
.jpg)
Warren Buffett Q2 2025 13F Analysis: Betting on UnitedHealth Again After 14 Years
TradingKey - In Q2 2025, the value of Berkshire Hathaway’s investment portfolio declined from $259.8 billion in Q1 to $257.5 billion, a decrease of 0.89%. Analysis indicates that this drop is primarily driven by a net capital outflow of 0.78%. The outflow may be linked to changing market conditions
After Plummeting 40%, Where Will UnitedHealth Group Stock Be in 1 Year? Here Is What History Suggests.
UnitedHealth Group (NYSE: UNH) has been one of the more interesting case studies in the stock market this year. Many stocks that have witnessed plummeting share prices can point to President Donald Trump's new tariff policies as the culprit.
.jpg)
Financial Indicators
EPS
Total revenue
Unitedhealth Group Inc Info
UnitedHealth Group Incorporated is an American multinational for-profit organization that specializes in health insurance and healthcare services, located in Eden Prairie, Minnesota. Operating under the UnitedHealthcare brand for insurance products and the Optum brand for healthcare services, it is recognized as the world's seventh-largest company by revenue and the largest healthcare corporation by revenue. The company ranks 8th on the 2024 Fortune Global 500 list, with a market capitalization of $460.3 billion as of December 20, 2024. UnitedHealth Group has encountered numerous investigations, lawsuits, and penalties—including SEC enforcement related to stock option backdating, Medicare overbilling, unfair claims practices, denials of mental health treatments, and anticompetitive conduct—illuminating deep-rooted issues of fraud, patient harm, and corporate misconduct.
Related Instruments
Popular Symbols
