

Nextera Energy Inc
NEEToday
+0.29%
5 Days
+1.79%
1 Month
+10.39%
6 Months
+26.84%
Year to Date
+11.45%
1 Year
+29.16%
TradingKey Stock Score of Nextera Energy Inc
Currency: USD Updated: 2026-02-06Key Insights
Nextera Energy Inc's fundamentals are relatively very healthy, with an industry-leading ESG disclosure.and its growth potential is high.Its valuation is considered fairly valued, ranking 10 out of 65 in the Electric Utilities & IPPs industry.Institutional ownership is very high.Over the past month, multiple analysts have rated it as Buy, with the highest price target at 92.30.In the medium term, the stock price is expected to remain stable.The company has been performing well in the stock market over the past month, which is supported by its strong fundamentals and technicals.The stock price is trading sideways between the support and resistance levels, making it suitable for range-bound swing trading.
Nextera Energy Inc's Score
Support & Resistance
Score Analysis
Media Coverage
Nextera Energy Inc Highlights
Analyst Rating
Nextera Energy Inc News
NextEra Energy 2025 Second Quarter Earnings Comments
TradingKey - NextEra Energy is optimistic about its 2025 full-year performance, expecting adjusted EPS to reach the upper end of the $3.45–$3.70 guidance range. This positive outlook is driven by strong performance in its core businesses: FPL, with nearly 8% regulated capital growth, and NEER...

Why Solar Stocks Plunged Today
Shares of solar stocks, including rooftop solar provider Sunrun (NASDAQ: RUN), renewables-focused utility NextEra Energy (NYSE: NEE), and renewable power provider AES Corp. (NYSE: AES), plunged on Thursday, falling 40%, 9.1%, and 5.2%, respectively, as of 12:50 p.m. ET.

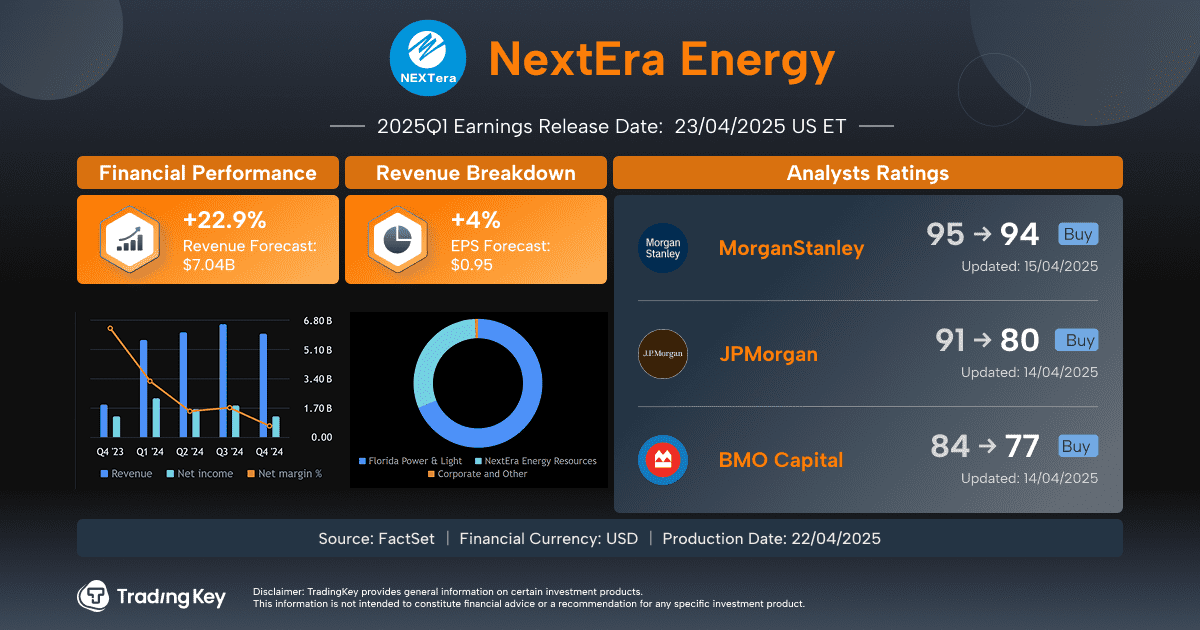
NextEra Energy (NEE) Q1 2025 Earnings Preview: Navigating Growth Amid Market Challenges
TradingKey - NextEra Energy (NEE) will release Q1 2025 results on April 23, 2025, premarket. The EPS is expected at $0.95, a slight increase from $0.91 in the comparable quarter the previous year.
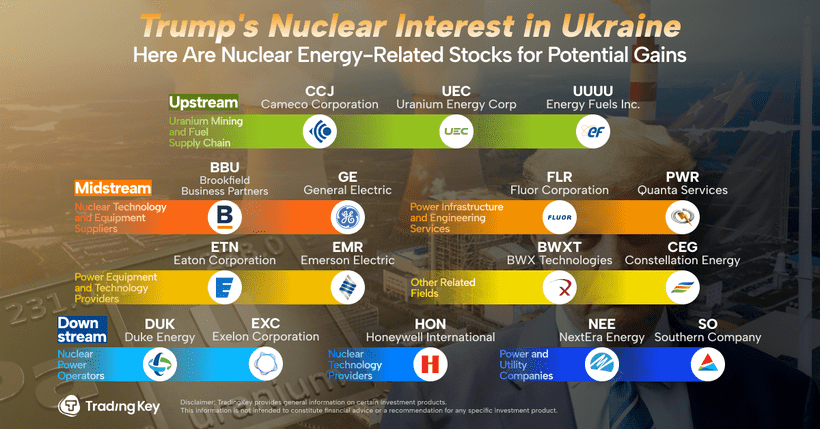
Trump's Nuclear Interest in Ukraine: Which Stocks Stand to Gain?
TradingKey - The Trump administration is seeking to establish new agreements with Ukraine regarding critical minerals and energy assets, expanding economic demands on Kyiv to facilitate a peace deal with Russia.
1 Dividend Stock That Just Gained 5% When the S&P 500 Index Plunged 3%
TradingKey - One of the world’s largest renewable energy developers – NextEra Energy Inc (NYSE: NEE) – was one of the few S&P 500 Index constituent stocks that actually rose on Monday.
Financial Indicators
EPS
Total revenue
Nextera Energy Inc Info
Related Instruments
Popular Symbols
