

Health Care Select Sector SPDR Fund
XLV
View Detailed Chart
157.710USD
+2.810+1.81%
Close 02/06, 16:00(ET)Quotes delayed by 15 min
13.62MVolume
762.37MTurnover
Intraday
1m
30m
1h
D
W
M
D
Today
+1.81%
5 Days
+1.92%
1 Month
-1.22%
6 Months
+22.25%
Year to Date
+1.88%
1 Year
+7.70%
View Detailed Chart
Health Care Select Sector SPDR Fund News
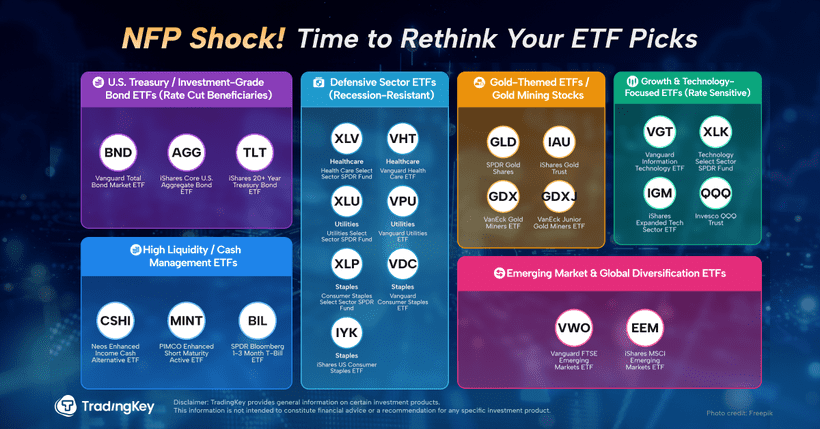
Post-NFP Shocker: What It Means for Your Portfolio
TradingKey - The latest data from the U.S. Bureau of Labor Statistics delivered a wake-up call. Job gains from the prior two months were revised down by 258,000 — a surprisingly large downgrade.
TradingKeyTue, Aug 5
BEST ETFs to BUY in July 2025
TradingKey - After a sharp V-shaped recovery in April and choppy gains through May, U.S. stocks accelerated their rally in June despite escalating Middle East tensions. The S&P 500 and Nasdaq Composite hit fresh year-to-date highs, underscoring the market’s resilience.
TradingKeyFri, Jul 4
Popular Symbols
278.120
+2.210 (+0.80%)
185.410
+13.530 (+7.87%)
69428.480
-172.700 (-0.25%)
282.580
+22.390 (+8.61%)
2070.380
-32.440 (-1.54%)
411.110
+13.900 (+3.50%)
4952.980
+142.360 (+2.96%)
63.303
+0.206 (+0.33%)
1.182
+0.004 (+0.35%)
157.098
+0.057 (+0.04%)
