

TLT
TLTToday
+0.07%
5 Days
+0.47%
1 Month
+0.30%
6 Months
-0.32%
Year to Date
+0.44%
1 Year
-2.57%
TLT News
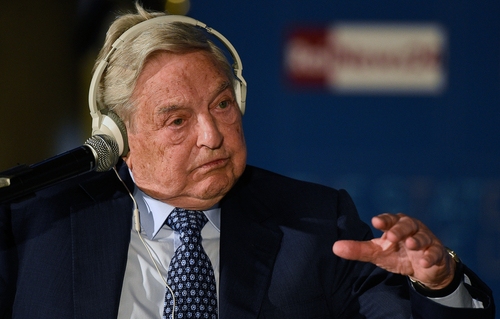
George Soros Q2 2025 13F Report: Tactical Bets and Market Mastery Unveiled
TradingKey - George Soros, the iconic financier and chairman of Soros Fund Management, remains a defining figure in global investing. Widely recognized for his theory of market reflexivity, which contends that investor biases and market fundamentals form feedback loops influencing asset prices
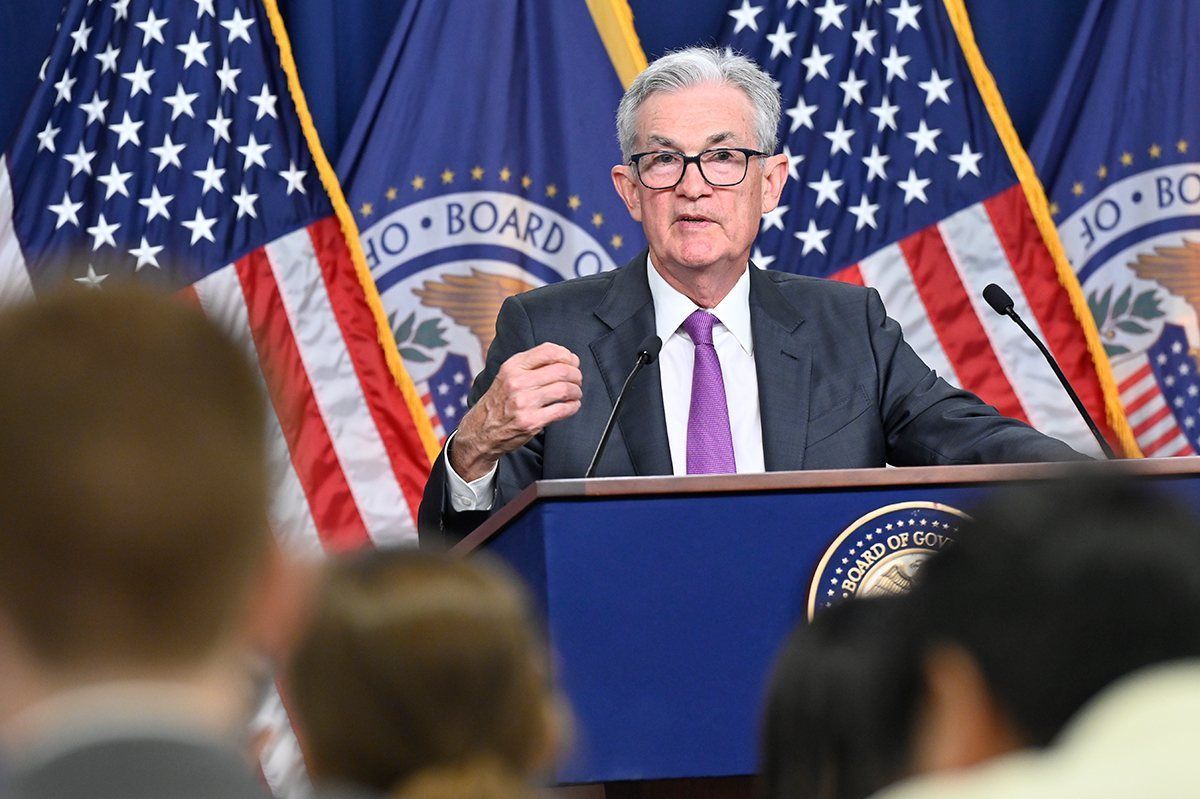
All Eyes on Powell: Will the Fed Blink Amid Economic Crosswinds?
TradingKey - The Federal Reserve is set to announce its latest interest rate decision this Thursday (ET). According to the CME FedWatch Tool, markets now assign a 97% probability that the Fed will hold rates steady this month.
The US 10-Year Treasury Yield Has Spiked: What It All Means for Investors
TradingKey - After President Trump’s “Liberation Day” trade tariffs announcement, one of the weirdest things to happen in market was that bond yields actually rose significantly.
Popular Symbols
