USD/SGD
USDSGD1.271USD
Today
-0.29%
5 Days
+0.32%
1 Month
-0.70%
6 Months
-1.06%
Year to Date
-1.06%
1 Year
-5.83%
Key Data Points
Opening Price
1.275Previous Closing Price
1.275Indicators
The Indicators feature provides value and direction analysis for various instruments under a selection of technical indicators, together with a technical summary.
This feature includes nine of the commonly used technical indicators: MACD, RSI, KDJ, StochRSI, ATR, CCI, WR, TRIX and MA. You may also adjust the timeframe depending on your needs.
Please note that technical analysis is only part of investment reference, and there is no absolute standard for using numerical values to assess direction. The results are for reference only, and we are not responsible for the accuracy of the indicator calculations and summaries.
USD/SGD Trading Strategy

Trading Strategy
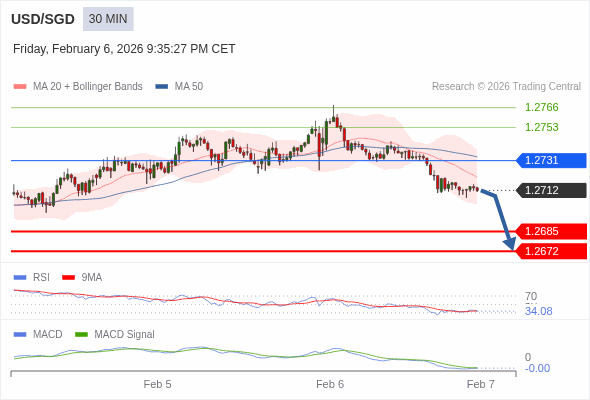
The configuration is negative.
Alternative scenario
above 1.2731, look for 1.2753 and 1.2766.
Comment
the downside prevails as long as 1.2731 is resistance
USD/SGD News
EUR and SEK seen as potential beneficiaries – ING
Despite limited euro-zone data and muted European Central Bank (ECB) messaging, EUR/USD could move toward 1.16 and potentially 1.17–1.1750 if concerns over Fed political risk ease, though geopolitical tensions around Greenland continue to cloud the outlook, ING's FX analyst Francesco Pesole notes.

USD/SGD: Consolidation on the daily chart – OCBC
USD/SGD continued to trade subdued in absence of fresh catalyst. Pair continues to hold around 1.3030 levels, OCBC's FX analysts Frances Cheung and Christopher Wong note.

As global growth falters, CHF stands out as a safe haven – Société Générale
With Europe battling fiscal fragility, the US facing valuation risks, and China confronting disinflation, the Swiss franc may again prove resilient.

EUR: 1.150 looks premature – ING
European currencies in general are enjoying good momentum, with the Swiss franc and the Swedish krona on top of this week’s G10 scorecard, ING’s FX analyst Francesco Pesole notes.

USD/SGD: Price pattern resembles a rising wedge – OCBC
USD/SGD was a touch firmer as Trump’s tariff threats ahead of 1 Feb deadline undermined sentiments. Pair was last seen at 1.3540, OCBC's FX analysts Frances Cheung and Christopher Wong note.

USD/SGD: Rebound is underway – OCBC
USD/SGD bounced as tariff concerns resurfaced. USD/SGD was last seen at 1.3515, OCBC’s FX analysts Frances Cheung and Christopher Wong note.

More Details of USD/SGD
What are the risks associated with trading USDSGD?
What is the typical volatility of USDSGD?
What is the significance of Singapore as a financial hub?
Related Instruments
Popular Symbols


