AUD/JPY
AUDJPY109.646USD
Today
-0.17%
5 Days
+1.71%
1 Month
+1.24%
6 Months
+15.17%
Year to Date
+4.85%
1 Year
+15.60%
Key Data Points
Opening Price
109.485Previous Closing Price
109.832Indicators
The Indicators feature provides value and direction analysis for various instruments under a selection of technical indicators, together with a technical summary.
This feature includes nine of the commonly used technical indicators: MACD, RSI, KDJ, StochRSI, ATR, CCI, WR, TRIX and MA. You may also adjust the timeframe depending on your needs.
Please note that technical analysis is only part of investment reference, and there is no absolute standard for using numerical values to assess direction. The results are for reference only, and we are not responsible for the accuracy of the indicator calculations and summaries.
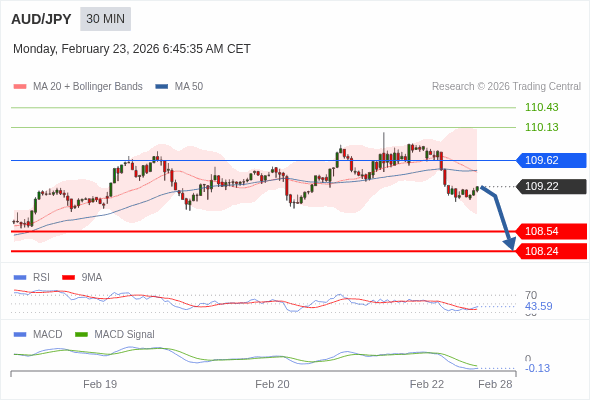
AUD/JPY Trading Strategy

Trading Strategy
The configuration is negative.
Alternative scenario
above 109.62, look for 110.13 and 110.43.
Comment
the downside prevails as long as 109.62 is resistance
AUD/JPY News
AUD/JPY Price Forecast: Falls to near 109.00 while staying above 100-day EMA, bullish bias intact
The AUD/JPY cross tumbles to near 109.05 during the early European session on Monday. Renewed trade war fears, rising geopolitical tensions in the Middle East, and uncertainty provide some support to a safe-haven currency such as the Japanese Yen (JPY) against the Aussie.

AUD/JPY Price Forecast: Keep bullish vibe above 109.00, Japan CPI inflation falls below BoJ’s target
The AUD/JPY cross loses ground to around 109.15 during the early European session on Friday. A shift toward risk-off sentiment and the downbeat Australian January employment data drag the Aussie lower against the Japanese Yen (JPY).

AUD/JPY holds near 109.00 as RBA-BoJ policy gap widens
The Reserve Bank of Australia (RBA) raised its cash rate by 25 basis points to 3.85% earlier this month, the first hike in over two years, citing a material pickup in inflation through the second half of 2025.

AUD/JPY holds steady near 109.00 after Australia jobs data
The AUD/JPY cross trades on a flat note near 109.00 during the Asian trading hours on Thursday. The release of the Australian employment report for January fails to boost the Australian Dollar (AUD) against the Japanese Yen (JPY).

AUD/JPY edges higher as RBA-BoJ policy divergence widens
AUD/JPY firmed modestly on Wednesday, climbing around 0.4% as the Reserve Bank of Australia's (RBA) hawkish stance continues to underpin the Australian Dollar (AUD) side of the cross.

AUD/JPY Price Forecast: Maintains bullish tone above 108.50, Australian jobs data in focus
The AUD/JPY cross holds steady near 108.55 during the early European trading hours on Wednesday. Growing optimism around Japanese Prime Minister Sanae Takaichi’s pro-stimulus policy agenda could support the Japanese Yen (JPY) and act as a headwind for the cross.

More Details of AUD/JPY
How do I know when to buy or sell AUDJPY?
Are there any specific risks associated with trading AUDJPY?
Is the AUDJPY pair suitable for beginner traders?
Related Instruments
Popular Symbols


