tradingkey.logo
XAUUSD

EUR/NOK

EURNOK
View Detailed Chart

11.8710NOK

-0.0599-0.50%
Time
1m
15m
30m
1h
4h
D
W
Please select

Today

-0.50%

5 Days

-1.01%

1 Month

+3.71%

6 Months

+0.29%

Year to Date

+0.96%

1 Year

+1.57%

View Detailed Chart

Key Data Points

Opening Price

11.9311

Previous Closing Price

11.9309
Price Range of the Day
11.836411.9613
52-Week Price Range
11.239612.2212

Indicators

The Indicators feature provides value and direction analysis for various instruments under a selection of technical indicators, together with a technical summary.

This feature includes nine of the commonly used technical indicators: MACD, RSI, KDJ, StochRSI, ATR, CCI, WR, TRIX and MA. You may also adjust the timeframe depending on your needs.

Please note that technical analysis is only part of investment reference, and there is no absolute standard for using numerical values to assess direction. The results are for reference only, and we are not responsible for the accuracy of the indicator calculations and summaries.

1m
5m
15m
30m
1h
2h
4h
D
W
M
1m
5m
15m
D
Neutral
Sell(4)
Neutral(2)
Buy(6)
Indicators
Sell(2)
Neutral(2)
Buy(2)
Indicators
Value
Direction
MACD(12,26,9)
0.021
Buy
RSI(14)
55.108
Neutral
STOCH(KDJ)(9,3,3)
35.640
Sell
ATR(14)
0.236
High Vlolatility
CCI(14)
-7.062
Neutral
Williams %R
35.809
Buy
TRIX(12,20)
0.179
Sell
StochRSI(14)
0.000
Oversold
Moving Average
Sell(2)
Neutral(0)
Buy(4)
Indicators
Value
Direction
MA5
11.931
Sell
MA10
11.954
Sell
MA20
11.729
Buy
MA50
11.657
Buy
MA100
11.684
Buy
MA200
11.733
Buy

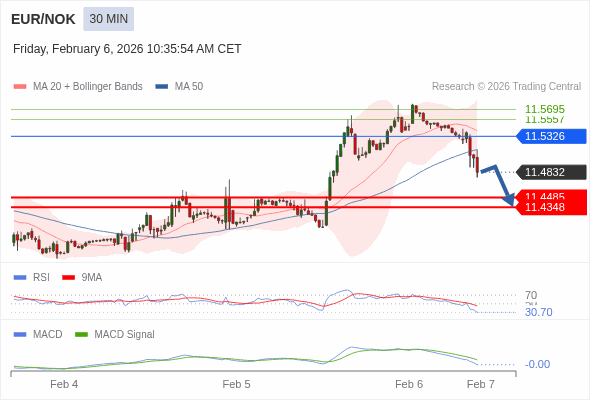
EUR/NOK Trading Strategy

Intraday
Medium Term
Short Term
Alternative scenario: the upside breakout of 12.1000 would call for 12.1780 and 12.2240.

Trading Strategy

Alternative scenario: the upside breakout of 12.1000 would call for 12.1780 and 12.2240.

Alternative scenario

above 12.1000, look for 12.1780 and 12.2240.

Comment

the downside prevails as long as 12.1000 is resistance.

Thu, Apr 17
Source: Trading Central(Reference Only)

EUR/NOK News

More news coming soon, stay tuned...

More Details of EUR/NOK

The EURNOK, or Euro vs Norwegian Krone, is a currency pair that represents the exchange rate between the Eurozone’s currency, the Euro (EUR), and Norway’s currency, the Norwegian Krone (NOK). As Norway is not a member of the European Union but closely linked to the EU through the European Economic Area (EEA), the EURNOK pair is influenced by a combination of European and Norwegian economic and political events. It is a less liquid pair compared to major currency pairs but offers unique trading opportunities due to Norway’s significant oil exports and its independent monetary policy.
Why do traders choose to trade the EURNOK currency pair?up
Traders may choose to trade EURNOK due to its sensitivity to oil prices, as Norway is a major oil exporter. Additionally, the pair can offer attractive interest rate differentials, making it appealing for carry trades.
How does the oil market affect the EURNOK exchange rate?up
Since Norway is a significant oil producer, fluctuations in oil prices can have a direct impact on the Norwegian Krone. Higher oil prices typically strengthen the NOK, while lower oil prices can weaken it.
Is the EURNOK pair considered a major or a minor currency pair?up
The EURNOK is generally considered a minor currency pair, as it does not involve the US Dollar and is less liquid than the major pairs.

EUR/NOK

11.8710

-0.0599-0.50%