Dow Jones Industrial Average rallies on Friday as rate cut hopes resume
- Dow Jones climbs 700 points on Friday in a recovery bid.
- September rate cut is still being priced in as a sure thing after US inflation print.
- With US PCE inflation in the books, markets will pivot to next Friday’s NFP.
The Dow Jones Industrial Average (DJIA) scorched 700 points higher on Friday after a close-enough-to-expectations print in US Personal Consumption Expenditures Price Index (PCE) inflation came in cool enough to allow investors to keep hopes for a September rate cut pinned to the ceiling. Markets are expecting the Federal Reserve (Fed) to hold rates steady for one more meeting in July before delivering the first quarter-point trim in a new rate-cutting cycle beginning in September.
Core US PCE inflation held steady at 2.6% YoY in June, flouting median market forecasts of a tick down to 2.5%. Near-term PCE inflation also accelerated MoM in June, rising to 0.2% from the forecast hold at 0.1%.
The University of Michigan’s (UoM) Consumer Sentiment Index fell less than expected in July, falling to an eight-month low of 66.4 instead of the forecast 66.0, but still lower than the previous 68.4. UoM 5-year Consumer Inflation Expectations also ticked higher to 3.0% in July, rising from the previous 2.9%.
Despite all the warning signs of a possible upturn in inflation pressures, markets decided on Friday that the figures weren’t enough to be worried about, and resumed pivoting firmly into risk-on sentiment and keep holding out hope for a September rate cut. According to the CME’s FedWatch Tool, rate markets are still pricing in one more hold from the Federal Open Market Committee (FOMC) on July 31, with 100% odds of at least a 25-basis-point cut on September 18. A particularly rate-cut-hopeful contingent sees 12% odds of a double cut in September for 50 bps.
Dow Jones news
The Dow Jones firmly recovered from a mid-week plunge, climbing over 700 points and outperforming the rest of the US equity indexes. The index climbed 1.8% on Friday, with nearly all of the DJIA’s constituent securities finding the green as the trading week winds down.
3M Co. (MMM) is single-handedly dragging the Dow Jones deep into the high end on Friday after reporting a $400 million revenue beat over estimates and raising the low end of the company’s forward guidance band. MMM rose 21% in Friday trading to cross over $125.00 per share and trading into a 23-month high.
Dow Jones technical outlook
The Dow Jones soared back over the 40,000.00 mega price handle on Tuesday, shrugging off mid-week declines and clawing back significant ground from a near-term decline from record peaks at 41,371.38. Friday’s rally etched in a fresh peak for the week, reversing several days of cautious declines and setting the DJIA up for a technical recovery heading into next week.
The Dow Jones continues to test chart paper on the high end, deep in bull country and trading 7% above the 200-day Exponential Moving Average (EMA) at 37,837.12. If short pressures resumes and drags the major equity index back into the low side, buyers will be looking to step in from the 50-day EMA at 39,527.96.
Dow Jones five minute chart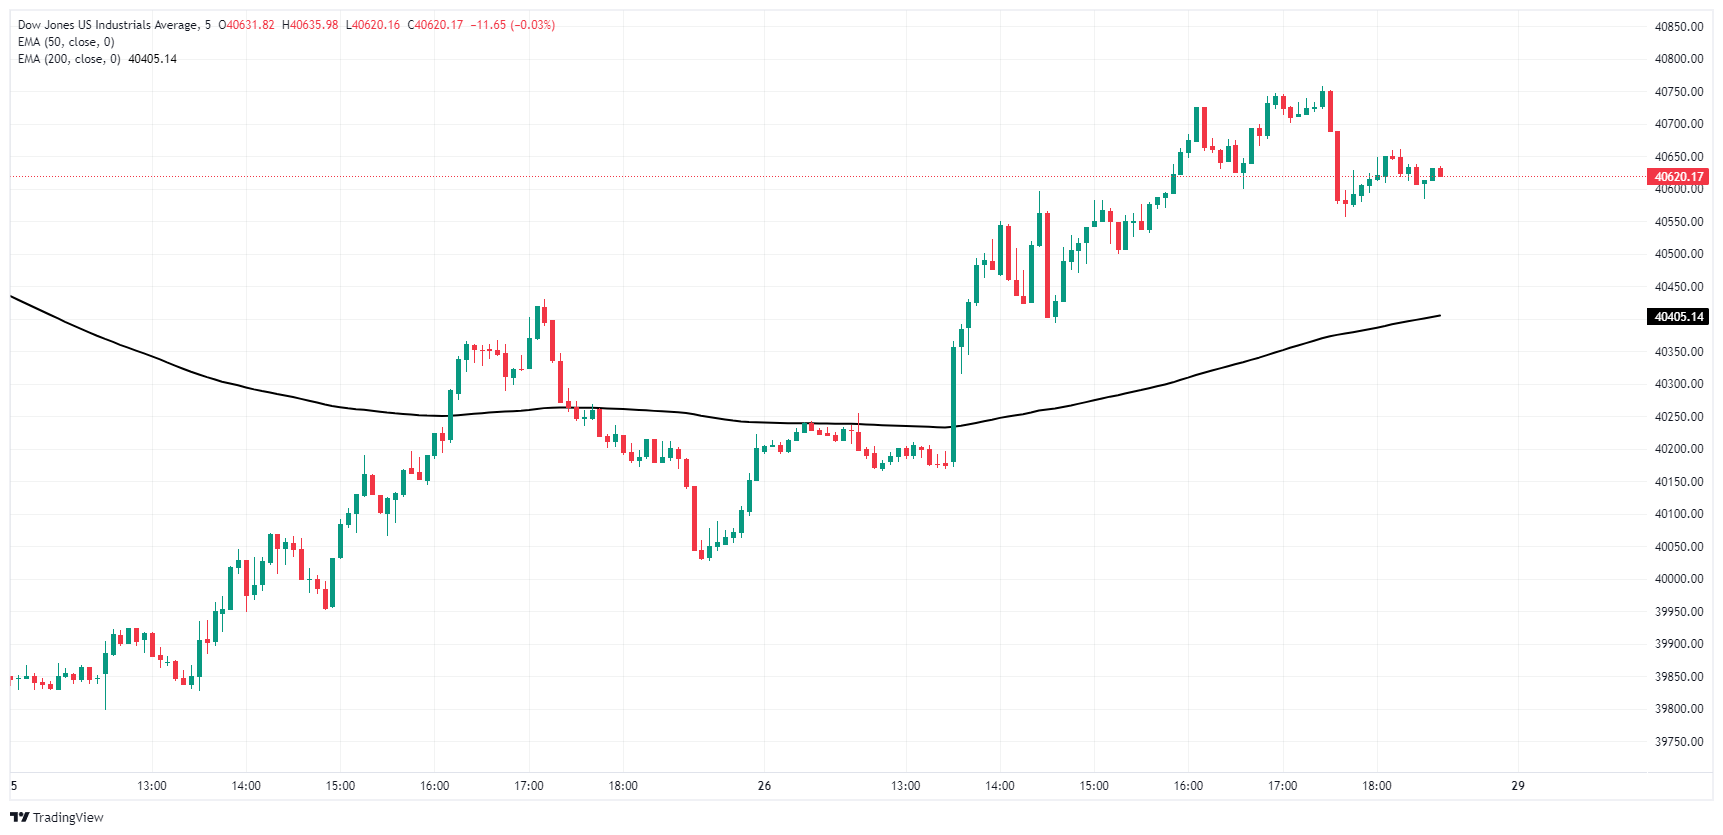
Dow Jones daily chart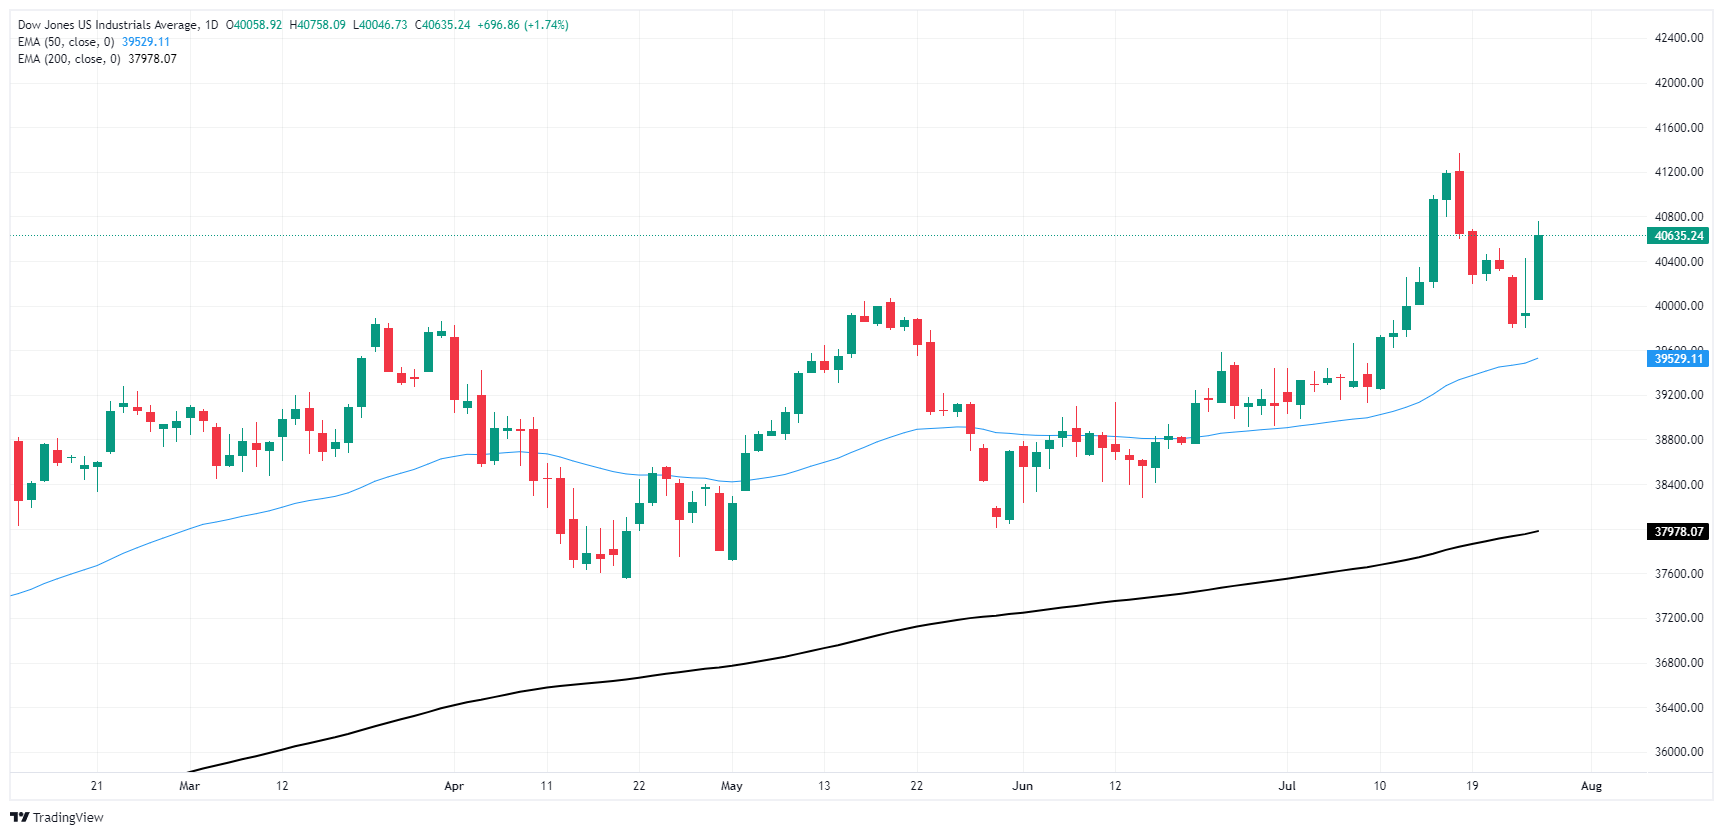
Economic Indicator
Core Personal Consumption Expenditures - Price Index (YoY)
The Core Personal Consumption Expenditures (PCE), released by the US Bureau of Economic Analysis on a monthly basis, measures the changes in the prices of goods and services purchased by consumers in the United States (US). The PCE Price Index is also the Federal Reserve’s (Fed) preferred gauge of inflation. The YoY reading compares the prices of goods in the reference month to the same month a year earlier. The core reading excludes the so-called more volatile food and energy components to give a more accurate measurement of price pressures." Generally, a high reading is bullish for the US Dollar (USD), while a low reading is bearish.
Read more.Last release: Fri Jul 26, 2024 12:30
Frequency: Monthly
Actual: 2.6%
Consensus: 2.5%
Previous: 2.6%
Source: US Bureau of Economic Analysis
After publishing the GDP report, the US Bureau of Economic Analysis releases the Personal Consumption Expenditures (PCE) Price Index data alongside the monthly changes in Personal Spending and Personal Income. FOMC policymakers use the annual Core PCE Price Index, which excludes volatile food and energy prices, as their primary gauge of inflation. A stronger-than-expected reading could help the USD outperform its rivals as it would hint at a possible hawkish shift in the Fed’s forward guidance and vice versa.
Related Articles
[Reuters Analysis] China stocks offer hedge against fading US exceptionalism: Taosha Wang
March 18 - U.S. equity markets are facing severe headwinds in early 2025, while Chinese equities rally, leaving global investors – structurally underweight China since 2021 – scrambling to adjust. This divergence underscores a critical question: Are Chinese stocks an effective hedge against fading U
[IN-DEPTH ANALYSIS] Constellation Energy (CEG): Deepseek Impact Meets Nuclear Power: Why CEG Is Still Underrated in the AI Era?
TradingKey - Surging electricity demand driven by AI data centers, electrification, and industrial growth exacerbates US power market tightness. DeepSeek’s efficiency gain may reduce per-unit power consumption, yet Jevons Paradox sustain long-term power demand resilience.
Market Week Ahead: Supercentral Bank Week and NVIDIA's GTC Highlights
TradingKey - Last week, the U.S. stock market extended its downward trend. The Dow Jones fell about 3.1%, marking its worst weekly performance since March 2023.
.jpg)
