Dow Jones Industrial Average finds thin gains amid quiet Monday markets
- Dow Jones climbed around one hundred points amid tepid Monday markets.
- Broad-market hopes for a Fed rate cut have run into the ceiling.
- Key US activity and inflation data looms ahead later in the week.
The Dow Jones Industrial Average (DJIA) climbed around one hundred points on Monday in a thin recovery from last week’s late pullback. Equities are drifting into the high end, but the Dow Jones is holding steady as investors gear up for a fresh round of key US data due later in the week.
According to the CME’s FedWatch Tool, rate markets are still pricing in an all-but-certain rate cut from the Federal Reserve (Fed) in September. Rate traders are pricing in 95% odds of at least a quarter-point rate trim when the Federal Open Market Committee (FOMC) meets on September 18.
A fresh round of S&P Global Manufacturing and Services Purchasing Managers Index (PMI) figures are due on Wednesday, followed by a Gross Domestic Product print on Thursday. Friday will wrap up the trading week with an update to the Personal Consumption Expenditure - Price Index (PCE) inflation figures.
Market participants looking for a Fed rate cut will be hoping for easing figures, and Wednesday’s Services PMI for July is expected to ease to 54.4 from 55.3. Annualized Q2 US GDP is expected to accelerate to 1.9% from 1.4%, and Friday’s PCE Price Index inflation for June is broadly expected to tick higher on the near end of the curve, forecast to print at 0.1% MoM versus the previous 0.0% print.
Dow Jones news
About a third of the Dow Jones is in the red on Monday, with concentrated losses in major names keeping prices more subdued across the wider index. Verizon Communications Inc. (VZ) reported a miss against quarterly revenue estimates, falling nearly 7% to $38.78 per share. On the high side, Nike Inc. (NKE) recovered ground on Monday, climbing 3.3% to $75.09 per share.
Dow Jones technical outlook
The Dow Jones is cycling familiar levels on Monday, but leaning into the bullish side. Intraday price action is crimped below 40,500.00, while a near-term floor is priced in near 40,200.00. Despite a rapid pullback from record highs last week, the Dow Jones is still trading firmly north of the 200-day Exponential Moving Average (EMA) at 37,893.31, and it won’t take much of a push for a fresh round of bidding to test into new record prices near 41,500.00.
Dow Jones five minute chart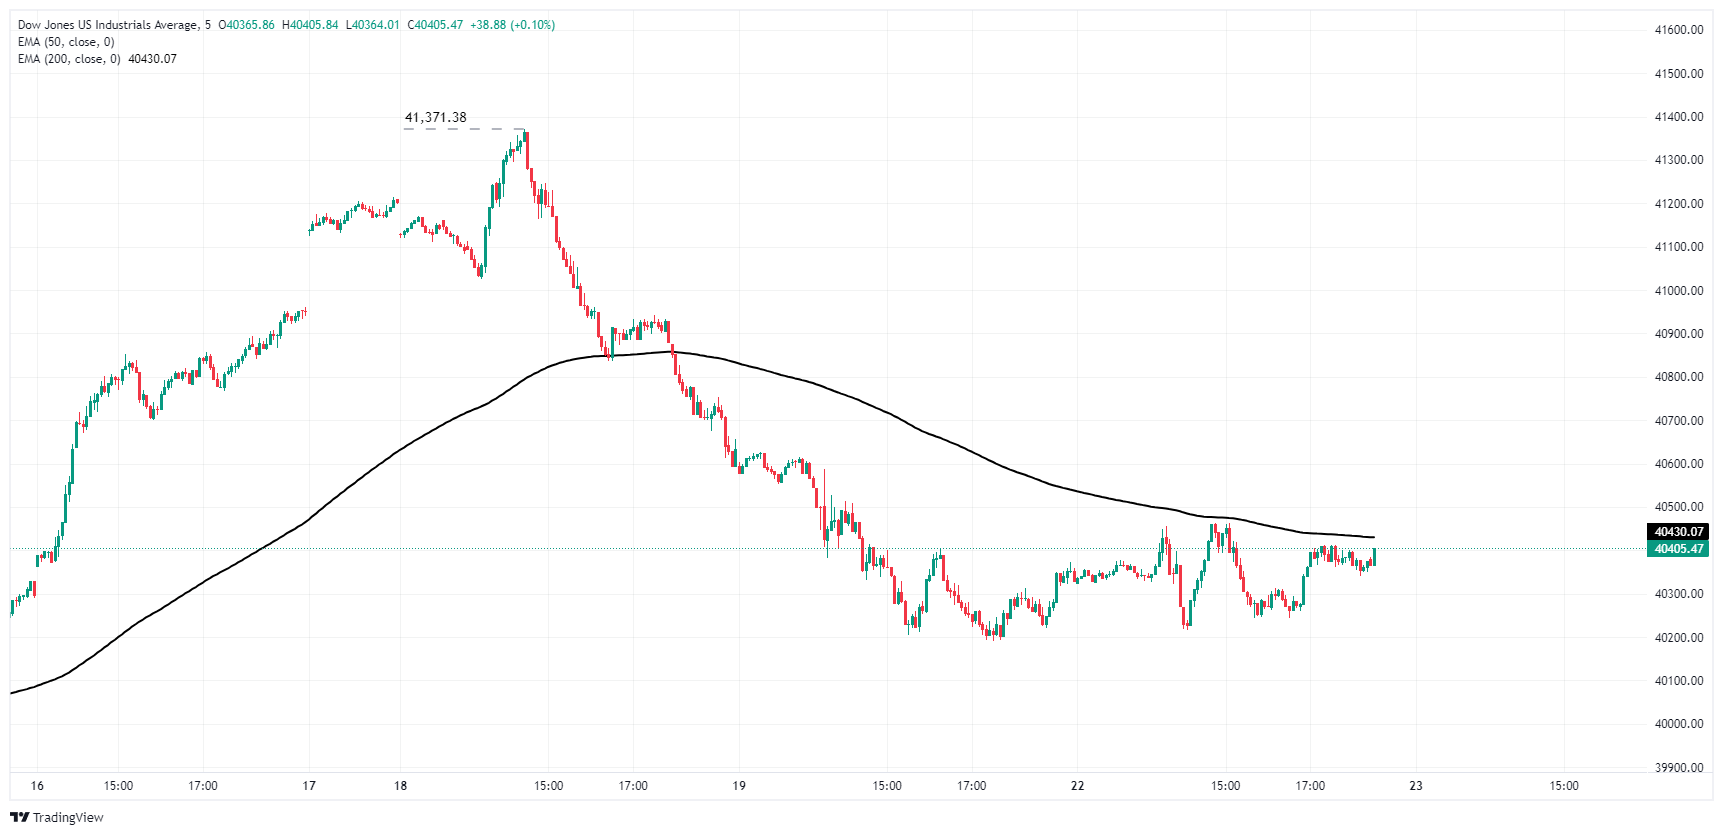
Dow Jones daily chart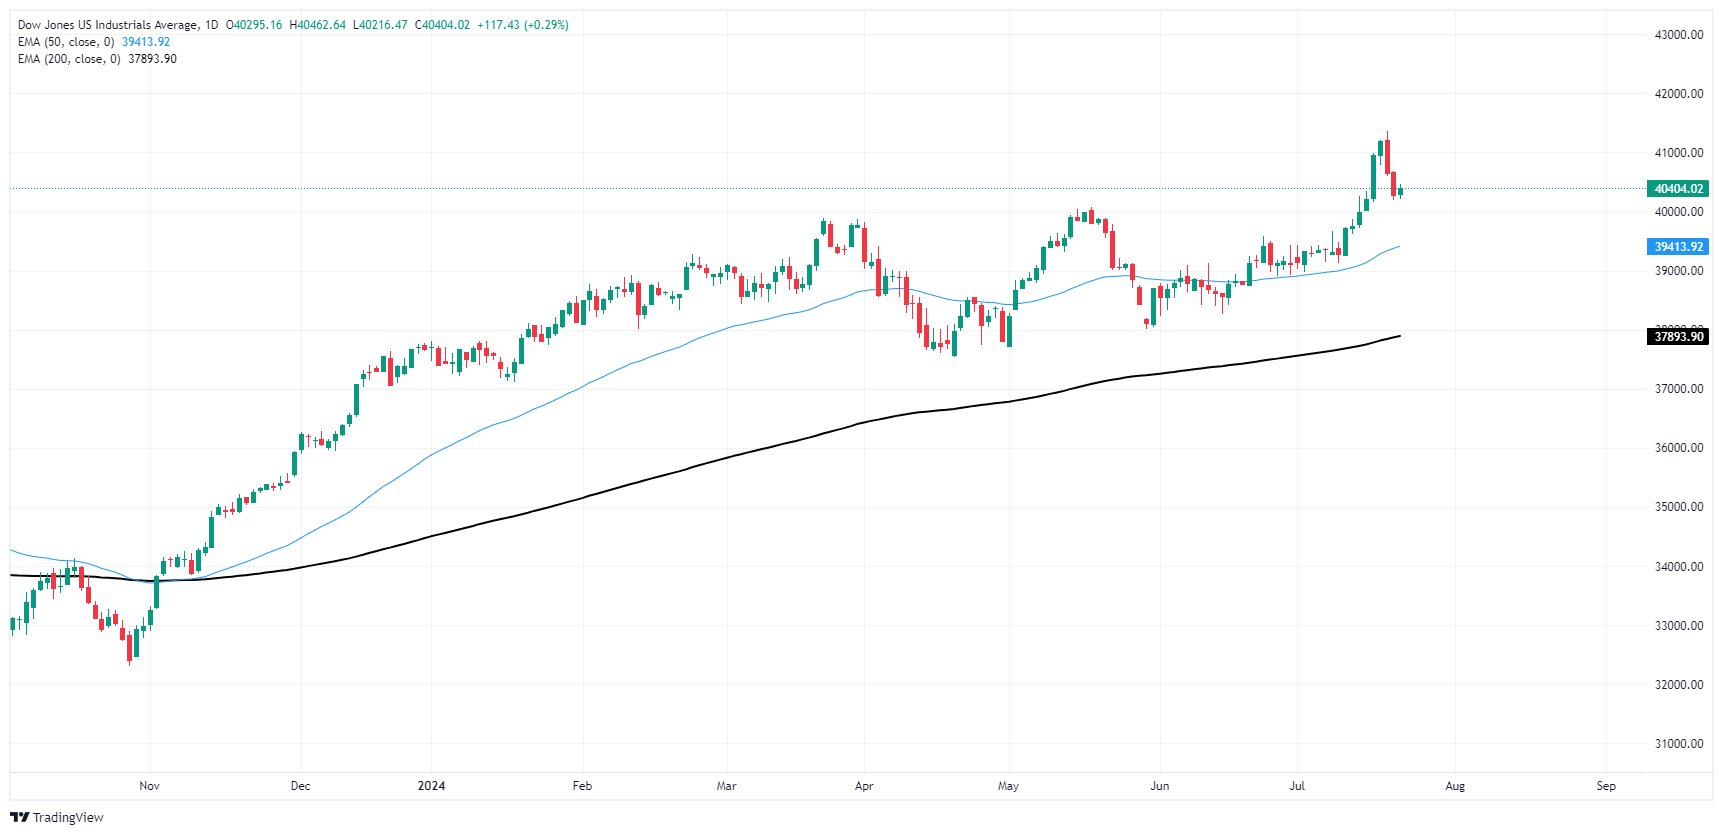
Economic Indicator
S&P Global Services PMI
The S&P Global Services Purchasing Managers Index (PMI), released on a monthly basis, is a leading indicator gauging business activity in the US services sector. As the services sector dominates a large part of the economy, the Services PMI is an important indicator gauging the state of overall economic conditions. The data is derived from surveys of senior executives at private-sector companies from the services sector. Survey responses reflect the change, if any, in the current month compared to the previous month and can anticipate changing trends in official data series such as Gross Domestic Product (GDP), industrial production, employment and inflation. A reading above 50 indicates that the services economy is generally expanding, a bullish sign for the US Dollar (USD). Meanwhile, a reading below 50 signals that activity among service providers is generally declining, which is seen as bearish for USD.
Read more.Next release: Wed Jul 24, 2024 13:45 (Prel)
Frequency: Monthly
Consensus: 54.4
Previous: 55.3
Source: S&P Global
Related Articles
[IN-DEPTH ANALYSIS] From Cash to Cards: Can Visa Keep Winning the Digital Payments Race
Faces consumer spending slowdown, regulatory pressures (e.g., UnionPay), BNPL/mobile payment competition, forex volatility, and Trump-led de-globalization risks.
Market Week Ahead: Supercentral Bank Week and NVIDIA's GTC Highlights
TradingKey - Last week, the U.S. stock market extended its downward trend. The Dow Jones fell about 3.1%, marking its worst weekly performance since March 2023.
[IN-DEPTH ANALYSIS] Trump Policies: Market Overreacted, Remain Bullish on Stocks
We believe the market is currently overemphasizing the impact of tariffs while overlooking other economic and political factors. In summary, we remain bullish on both U.S. and European stocks..jpg)
What Should Investors Watch With the Upcoming Federal Reserve FOMC From 18-19 March 2025?
TradingKey - It has been a rough three weeks for investors in US stock markets. The S&P 500 Index took just 16 trading sessions to fall 10%, what is officially termed a “correction”.
Bitcoin On-Chain Data Analysis
Based on the analysis of on-chain data, it is understood that Bitcoin has not yet reached the top of the bull market; currently, there is little risk of overheating. It is anticipated that there will be another major upward trend, but the market may experience short-term fluctuations.