[IN-DEPTH ANALYSIS] From Cash to Cards: Can Visa Keep Winning the Digital Payments Race


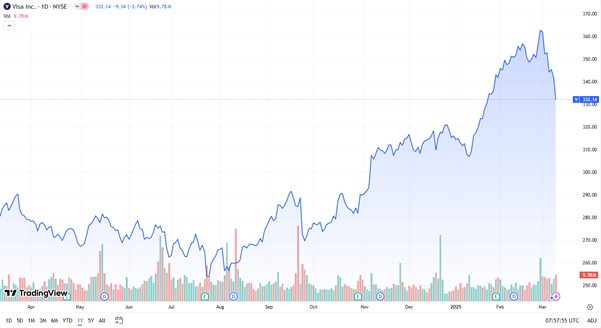
Source: TradingView
Key Takeaways
- Market Leader: Visa holds a 38.66% global transaction share (H1 2024), with $35.93 billion in revenue (up 10.02%) and 4.577 billion cards (up 7.3%) in FY 2024.
- Financial Edge: EPS rose 17.51% to $9.74, with an 82.56% gross margin and low debt (0.53 debt-to-equity), fueling a moderate dividend increase.
- Growth Drivers: Targets 9-12% revenue growth via Consumer Payments ($45T TAM), CMS ($200T TAM), and VAS ($520B TAM).
- Target Price: 2025 EPS projected at $11.30, with a 30x P/E yielding a $339 target, aligning with the current price.
- Risks: Faces consumer spending slowdown, regulatory pressures (e.g., UnionPay), BNPL/mobile payment competition, forex volatility, and Trump-led de-globalization risks.
1.Company Overview
Visa Inc., a global leader in payment technology, was founded in 1958 and is headquartered in San Francisco, California. As a credit card association, its core business leverages the VisaNet global payment network to connect consumers, merchants, financial institutions, and governments, facilitating credit, debit, and prepaid card transactions.
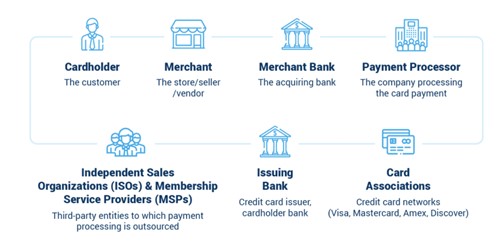
Payment Process Overview
In the payment process, the cardholder (consumer) initiates the payment using a Visa card at the merchant (store/vendor). The merchant sends the payment request to the merchant bank (acquiring bank), which forwards it to the payment processor to handle and verify the payment information. The request is then sent to the issuing bank (cardholder's bank) for authorization. Finally, the card associations (e.g., Visa, Mastercard) ensure the transaction meets their standards, and completes the payment.
Source: Paymentdepot
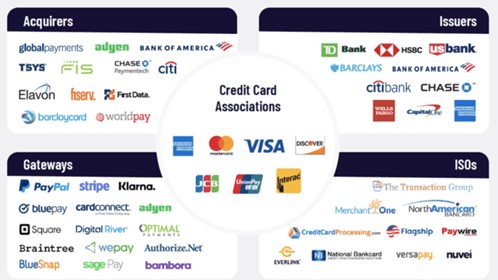
Key Roles in the Payment Ecosystem
The five key roles in the payment industry are: Acquirers, such as global payments providers and banks, which work with merchants to process transactions; Issuers, including banks like Citibank and American Express, which provide credit cards and authorize payments; Credit Card Associations, like Visa and Mastercard, which set the standards and facilitate the payment process; Gateways, such as PayPal and Stripe, which securely transmit payment information between merchants and processors; and ISOs (Independent Sales Organizations), which help merchants with payment solutions and outsourcing processing tasks.
Visa plays the role of a Credit Card Association, ensuring the security and standardization of transactions, coordinating the payment flow, and facilitating the process through its global network.
Source: Merchantcostconsulting
2.Visa's Strategic Ecosystem
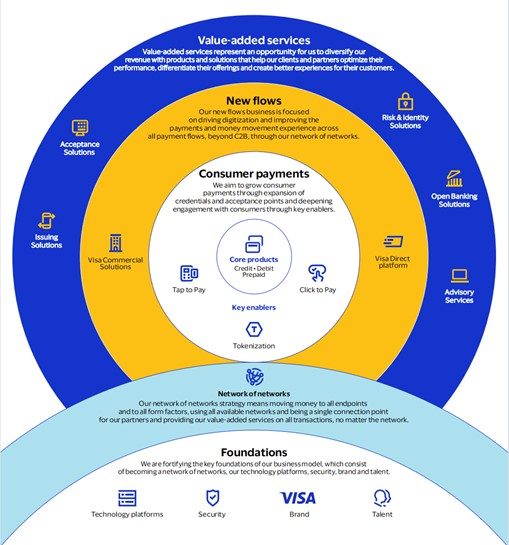
Visa's strategy focuses on three main areas: consumer payments, new flows, and value-added services. By expanding payment credentials and acceptance points, Visa aims to transform traditional payment methods such as cash and checks into cards and digital accounts on the Visa network, driving the growth of consumer payments by innovating payment solutions like Tap to Pay, Tokenization, and Click to Pay. Its core products include credit cards, debit cards, and prepaid cards, which support global consumer and merchant payment needs.
In new flows, Visa focuses on driving the digitalization of P2P, B2C, B2B, and G2C payment flows through the Visa Direct platform, providing efficient solutions for both cross-border and local payments. Additionally, Visa diversifies its revenue through value-added services such as issuing solutions, acceptance solutions, and risk management. Through its "network of networks" strategy, Visa ensures cross-platform interoperability and leverages its foundations, such as strong technology and security infrastructure to enable seamless global payments.
Source: Visa
3.Visa's Core Revenue Model: A Transaction-Driven Growth Engine
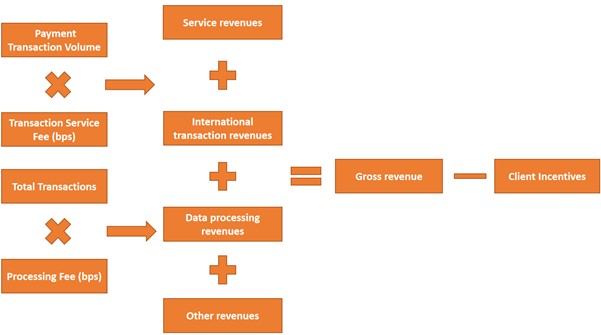
Building on its core products of credit, debit, and prepaid cards, Visa’s revenue model is primarily driven by the growth of payment transaction volume and transaction counts. Its revenue streams are divided into four key components: First, Visa earns transaction service fees, which are calculated based on the payment transaction volume and service fee rate. Second, Visa generates income from international transactions, which is based on the amount and number of cross-border transactions. Third, data processing revenues are earned by processing transaction data, with fees charged per transaction. Finally, Visa also earns income from other value-added services. Gross revenue is derived from these streams, and after deducting client incentives, the net revenue is obtained. In short, Visa's revenue model relies on the widespread use of its global payment network, generating consistent revenue streams through transaction processing and related fees.
Source: TradingKey
Source: TradingKey, Nilson Report
Transactions Analysis
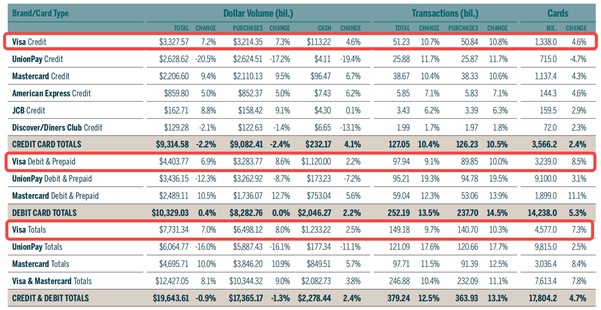
In the first half of 2024, Visa, UnionPay, Mastercard, American Express, JCB, and Discover/Diners Club brand credit, debit, and prepaid cards collectively accounted for 363.93 billion purchase transactions for goods and services worldwide. This represented a 13.1% growth compared to the same period in 2023.
Visa remained the global leader with a market share of 38.66%, although it experienced a slight decrease from 39.63% during the first six months of 2023. UnionPay, in second place, saw a notable increase in market share, rising from 31.84% in the first half of 2023 to 33.15% in 2024. Mastercard's market share slightly decreased to 25.11% from 25.25%.
In credit card purchase transactions, Visa's market share grew slightly to 40.28% from 40.15%. Mastercard's share increased marginally to 30.36% from 30.34%, and UnionPay's share rose to 20.49% from 20.26%. However, American Express’s share fell to 4.62% from 4.76%, JCB’s share declined to 2.69% from 2.79%, and Discover/Diners Club’s share decreased to 1.56% from 1.69%.
When considering only debit card purchase transactions, UnionPay’s market share rose to 39.87% from 38.22%, while Visa’s share dropped to 37.80% from 39.34%. Mastercard's share also saw a slight decrease, slipping to 22.32% from 22.45%.
Volume Analysis
In the first half of 2024, the total purchase volume for all global brands amounted to $17.365 trillion, representing a 1.3% decrease on a local currency basis. Visa surpassed UnionPay in combined credit, debit, and prepaid card purchase volume, as well as in both credit card and debit/prepaid card purchase volume.
Visa’s market share for purchase volume in the first half of 2024 was 37.42%, an increase from 34.22% in the same period of 2023. In contrast, UnionPay's share decreased to 33.90% from 39.92%. Mastercard saw its share grow to 22.15% from 19.71%, while American Express's share rose to 4.91% from 4.62%. JCB's share also increased to 0.91% from 0.83%, while Discover/Diners Club’s share remained steady at 0.71%.
Cards Analysis
As of June 30, 2024, the total number of global brand cards in circulation reached 17.80 billion, reflecting a 4.7% increase compared to the same date in 2023. Visa's total card circulation reached 4,577 million, representing a 7.3% increase. Specifically, Visa credit cards saw a 4.6% growth with 1,338 million cards in circulation, the fastest growth among all competitors. Meanwhile, Visa debit and prepaid cards experienced a substantial 8.5% increase, totaling 3,239 million cards. Although Mastercard led with the largest percentage growth of 11.1%, UnionPay's debit card circulation is significantly large, with 91 million cards in circulation.
4.Financials & Valuation
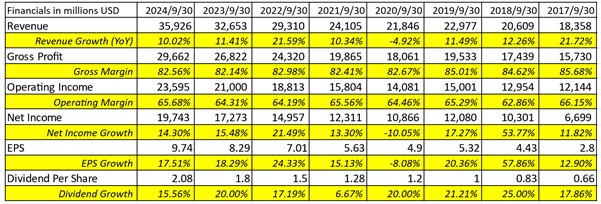
Visa's financial performance is strong, with 2024 revenue reaching $35.93 billion, growing by 10.02%. The gross margin stands at 82.56%, and the operating margin is 65.68%. Net income grew by 14.30%, and earnings per share (EPS) reached $9.74, up by 17.51%, demonstrating consistent profitability. The dividend increased by 16%, reflecting stable cash flow and a commitment to shareholder returns. Overall, Visa excels in revenue, profitability, and shareholder returns, showcasing its solid position and strong growth potential in the payments industry.
Source: TradingKey, Visa
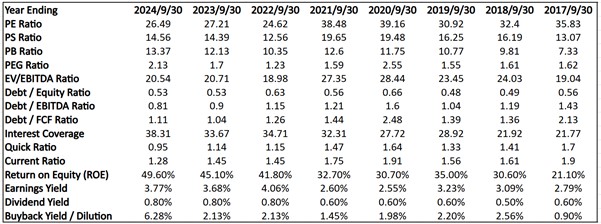
Visa’s 2024 valuation shows a PE ratio of 26.49, which is lower than its historical average, suggesting a relatively low valuation. With a PEG ratio of 2.13, Visa's growth is priced at a premium, potentially signaling overvaluation. Visa’s debt levels are low, with a debt-to-equity ratio of 0.53 and a debt-to-EBITDA ratio of 0.81, highlighting strong financial health. The high return on equity (49.60%) further underscores its efficient use of capital. Overall, while Visa is somewhat richly valued, its strong asset base, low leverage, and robust profitability suggest it remains a solid investment.
Source: TradingKey, Visa
5.Growth Potential
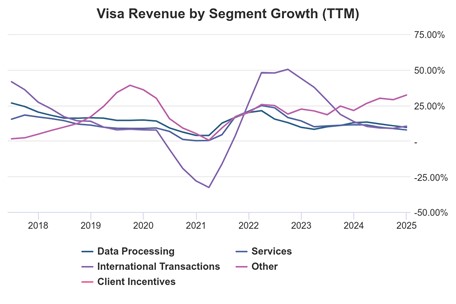
It is obvious that Visa's revenue streams have largely reached scale, and growth has begun to stabilize. With strong gross margins, a clear network effect, and solid security that is reinforced by its well-established brand, Visa provides a level of moat that competitors cannot easily challenge in the short term.
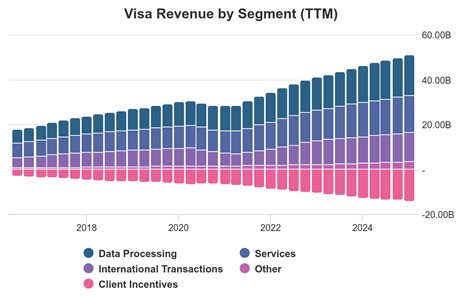
Source: Stock Analysis
Source: Stock Analysis
Given the stability of Visa's current core business, the company is continuously seeking new growth opportunities. At its latest Investor Day, management provided an optimistic outlook, projecting a 9-12% net revenue increase over the medium to long term. This growth trajectory is expected to be driven by three strategic pillars: consumer payments, commercial & money movement solutions (CMS), and value-added services (VAS).
Consumer Payments
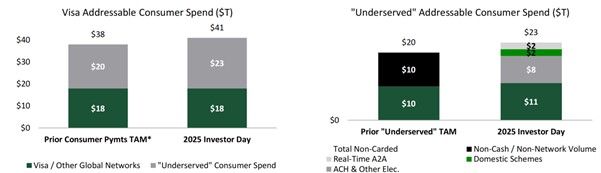
Based on the data, Visa’s consumer payments business targets a $45 trillion Total Addressable Market, with $23 trillion still tied up in “underserved” cash, checks, and ACH(Automated Clearing House) transactions. Innovations like Tap to Pay—boasting a 74% global penetration rate in 2024 (60% in the U.S.)—and tokenization (12.66 billion tokens by Q1 2025) are Visa’s weapons of choice, converting old-school payments into digital gold. With cross-border volumes up 16% in Q1 2025 and a projected 5-7% growth rate, this segment continues to be Visa's foundation, demonstrating that even in the digital age, the battle against cash is far from over.
Source: TD COWEN, Visa
Commercial & Money Movement Solutions (CMS)
CMS is Visa’s strategy to capture a share of the enormous $200 trillion market, which includes $145 trillion in business-to-business (B2B) transactions and $55 trillion via Visa Direct (P2P, B2C, G2C). Visa’s division has seen rapid growth, increasing by 22% annually over the past three years, reaching $1.7 trillion in transactions in 2024. Visa Direct generates about 9-10 cents per transaction, while B2B transactions bring in 17-19 basis points fueling high-margin growth. With moves like acquiring Currencycloud, Visa is simplifying cross-border payments for businesses and enabling small businesses to digitize. There's still significant potential for growth in this money-transfer sector.

Source: TD COWEN, Visa
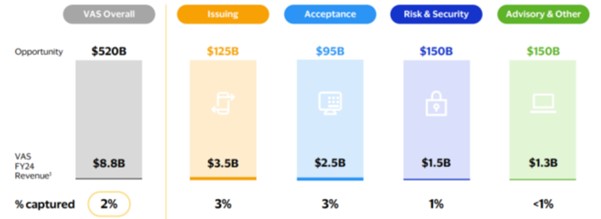
Value-Added Services (VAS): The Hidden Treasure
VAS is Visa's hidden gem, contributing $8.8 billion in FY 2024—accounting for 24% of net revenue—from a $520 billion total addressable market (TAM), where it has only just begun to tap into 2%. With a 20% compound annual growth rate (CAGR) over the past three years and 35% of revenue coming from non-Visa, non-card sources, VAS represents the kind of diversification that the market highly favors. Looking ahead, Visa aims for VAS to account for over 50% of its future revenue (up from 2024), with offerings such as issuing solutions, fraud protection, and consulting through the "Visa-as-a-Service" model, all of which are poised for substantial growth in the high teens.
Source: Visa
6.Target Price
Based on an EPS of $9.74 for 2024, representing a growth of 17.51%, and factoring in the projected 9-12% net revenue growth guidance along with the high growth of VAS and CMS (16-18%), the expected EPS for 2025 is projected to be $11.30. Taking into account Visa's high-profit margins (with a gross margin of 82.56% in 2024), stable cash flow (FCF yield of 3.4%-3.7%), and the premium implied by its historical P/E range (26.49-35x), I estimate a reasonable P/E multiple of 30x for 2025. This results in a target price of $339 for the next 12 months, which is in line with the current stock price.
7.Risks
However, Visa faces multiple risk factors that could challenge its growth:
- Economic Slowdown: A slowdown in consumer spending, particularly in the U.S. and emerging markets, may weaken transaction volume growth.
- Regulatory Pressures: The rise of government-backed local payment systems (e.g., increasing market share of UnionPay) introduces competition. In addition, Antitrust lawsuits create uncertainty, potentially impacting operations and profitability.
- Competitive Threats: Emerging payment methods like Buy Now Pay Later (BNPL) threaten traditional card payments. The convenience and widespread adoption of mobile payments (e.g., Apple Pay, Google Pay) erode credit card market share.
- De-globalization Trends: The accelerated de-globalization process, driven by Trump’s policies such as tariff barriers and the "America First" agenda, could reduce cross-border transaction revenues.
Although credit card payment habits are deeply ingrained in Western societies and unlikely to change in the short term, the combination of these external factors still poses a substantial risk to Visa's long-term growth prospects.