[IN-DEPTH ANALYSIS] Ford (F): From Bronco to Lightning: Reviving the American Dream amid Tariff Storms

Source: TradingView
Key Points
- Ford's 2024 Financial Resilience & Segment Divergence. Despite record revenue driven by Ford Pro's dominance, the electric vehicle division deepened losses.
- U.S.-Mexico-Canada supply chain dependencies expose Ford to cost hikes under 25% tariffs, risking 2025 net profit drop of 20–30%.
- Ford shifts focus to EREV for large trucks/SUVs, targeting commercial fleets and avoiding pure EV risks.
- Ford is currently undervalued with a P/E ratio of 6.6x, a high dividend yield offering recession safety, but faces headwinds from tariffs and EV losses; potential 5–10% upside to $11–$12 in this year if tariff exemptions occur.
Overview
TradingKey - Ford Motor Company, founded in 1903 and headquartered in Dearborn(quite near Detroit), Michigan, is one of the world’s oldest automakers and the second-largest in the U.S. by revenue. The company employs approximately 183,000 people globally by 2024 and operates across 3 core segments: internal combustion vehicles (Ford Blue), commercial vehicles & software (Ford Pro), and electric vehicles (Ford Model e).
The development history of Ford Motor symbolized America's innovative spirit, industrial strength and the pursuit of freedom. By launching various classic models such as the F-Series pickup trucks, Mustang and Thunderbird, Ford has promoted the rise and development of cultures such as muscle car culture and road trip style. It is also a symbol of American rural life, cowboy culture and blue-collar workers.
Revenue Sources
Ford Motor’s diversified product portfolio is structured through three pillars:
1) Ford Blue: Focusing on the field of fuel-powered vehicles, it achieved sales of 2.9 million units throughout the year, with revenue exceeding $102 billion. In 2024, the revenue of this department accounted for 55%, but the profit margin decreased by 2.1 percentage points year-on-year. Its core products include the F-Series pickup trucks (the global sales champion, with a growth of 5% in 2024), Mustang sports cars, and SUV models. Among them, the Bronco has become the main growth driver in the North American market (+20%). In 2024, the hybrid version of the F-150 Hybrid was launched, with a comprehensive energy efficiency improvement of 20%.
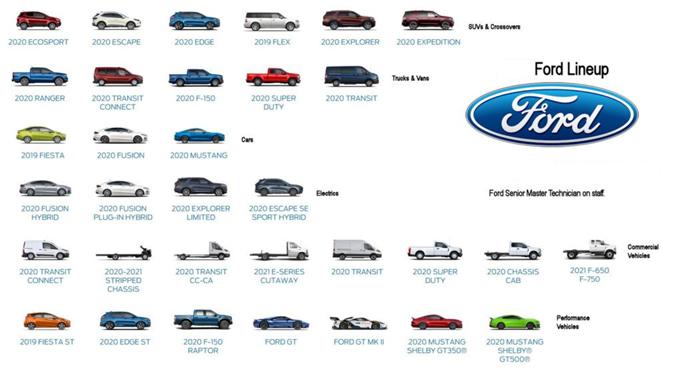
Source: crawfords autoservice
2) Ford Pro: Engaged in commercial vehicles and automotive software services, it sold 1.5 million units, with revenue exceeding $67 billion and an increase of 9.2%. It covers Super Duty trucks (with a sales growth of 10%), Transit vans, and fleet management solutions. Both the number of paying software subscription users and telematics services have achieved double-digit growth. In 2024, the revenue of this department accounted for 36%, and the EBIT profit margin was 13.5%, serving as the core profit engine, benefiting from the demand for Super Duty trucks and the software subscription model (such as Ford Pro Intelligence).
3) Ford Model e: In 2024, it sold 105,000 units, a YoY decrease of 9%, with revenue of $3.9 billion, and currently, its revenue accounts for only 2%. It focuses on electric vehicles and intelligent technologies, concentrating on the electric pickup truck F-150 Lightning, high-end SUVs (such as the Mustang Mach-E), and the research and development of next-generation batteries. However, due to the drag of investment in battery factories and research and development expenses, it suffered a loss of $5.1 billion in 2024.
Quarter | 31-Dec-24 | 30-Sep-24 | 30-Jun-24 | 31-Mar-24 | 31-Dec-23 | 30-Sep-23 | 30-Jun-23 | 31-Mar-23 |
Total | 1.19M | 1.10M | 1.14M | 1.05M | 1.15M | 1.09M | 1.12M | 1.06M |
Total Growth | 3.04% | 0.83% | 2.06% | -0.95% | 0.44% | -0.09% | 8.43% | 9.21% |
Ford Blue | 774.00K | 721.00K | 741.00K | 626.00K | 758.00K | 736.00K | 720.00K | 706.00K |
Ford Blue Growth | 2.11% | -2.04% | 2.92% | -11.33% | -0.26% | -0.67% | 7.46% | 6.49% |
Ford Pro | 378.00K | 342.00K | 375.00K | 409.00K | 361.00K | 314.00K | 365.00K | 337.00K |
Ford Pro Growth | 4.71% | 8.92% | 2.74% | 21.36% | 0.84% | -2.18% | 7.99% | 18.25% |
Ford Model E | 37.00K | 32.00K | 26.00K | 10.00K | 34.00K | 36.00K | 34.00K | 12.00K |
Ford Model E Growth | 8.82% | -11.11% | -23.53% | -16.67% | 13.33% | 44.00% | 41.67% | -33.33% |
Source: TradingKey, SEC Filings
Tariff Impact: Cost Shocks and Supply Chain Disruption
Ford's supply chain is highly dependent on collaborative production among the United States, Mexico, and Canada. Typically, engines are manufactured in Canada, transmissions come from Mexico, and electronic system components originate in Asia, with less than 50% of parts sourced domestically in the U.S. The Anderson Economic Group estimates that steel and aluminum tariffs have increased the cost of producing a vehicle in the U.S. by $1,500. Assuming adding a 25% tariff on auto parts, the cost per vehicle rises by approximately $3,000 to $4,000.
Judging from the chart below, in fact, Ford's dependence on Mexico and Canada is lower than that of some competitors, but its huge production scale means a larger absolute risk exposure. In terms of production volume, Ford Motor's production volume in North America ranks second only to General Motors. However, approximately 20% of the components for Ford vehicles come from Mexico or Canada, which is significantly lower than the industry average level (for example, the dependence on Mexico and Canada of automakers such as Honda and Stellantis exceed 40%).
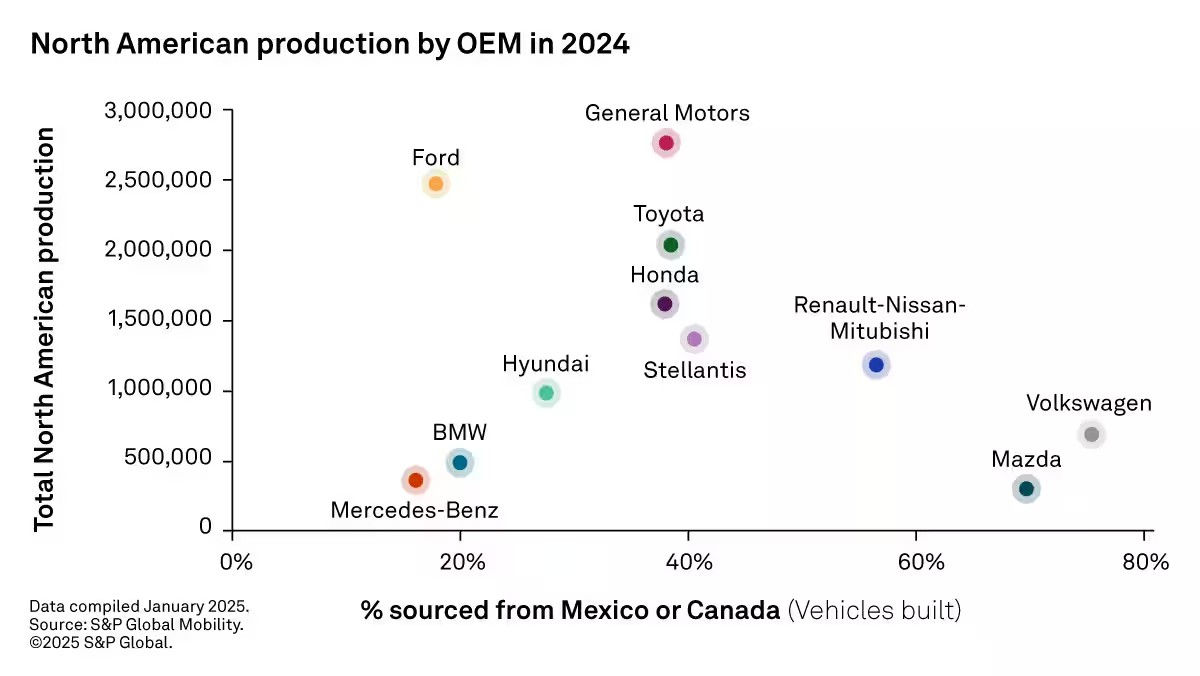
Source: S&P Global Mobility
The implementation of tariff policies led U.S. consumers to rush to buy cars to avoid future price hikes. Data shows that Ford's sales in March increased by 10% YoY. However, Cox Automotive predicts that U.S. auto sales are expected to decline by 4% in 2025. From the signs of weakening demand, Ford may struggle to pass on costs to downstream consumers, with its gross margin potentially falling from 12.5% in 2024 to 9% and net profit likely decreasing by 20%-30%. Electric models such as the F-150 Lightning, already burdened by high battery costs, may see gross profit margins drop below 5%, and the launch of some 2025 models could be delayed due to battery tariffs.
Even under a partial tariff exemption scenario, and with expectations that Ford's U.S. business will achieve significant progress in supply chain efficiency, the impact of tariff hikes will persist in 2025 and 2026. The combined effects of cost increases, sales losses due to price elasticity, and an unfavorable consumer environment will generate severe negative impacts. In a scenario where tariff hikes lead to a mild industry recession, Ford's sales could face an additional 5% downward pressure. Overall, the projected industry recession is milder than the shocks of 2020 or 2008 (in which year the sales volume declined by more than 30%).
EXHIBIT : Ford US automotive sales volume 2000 - 2024 (in millions of units)。
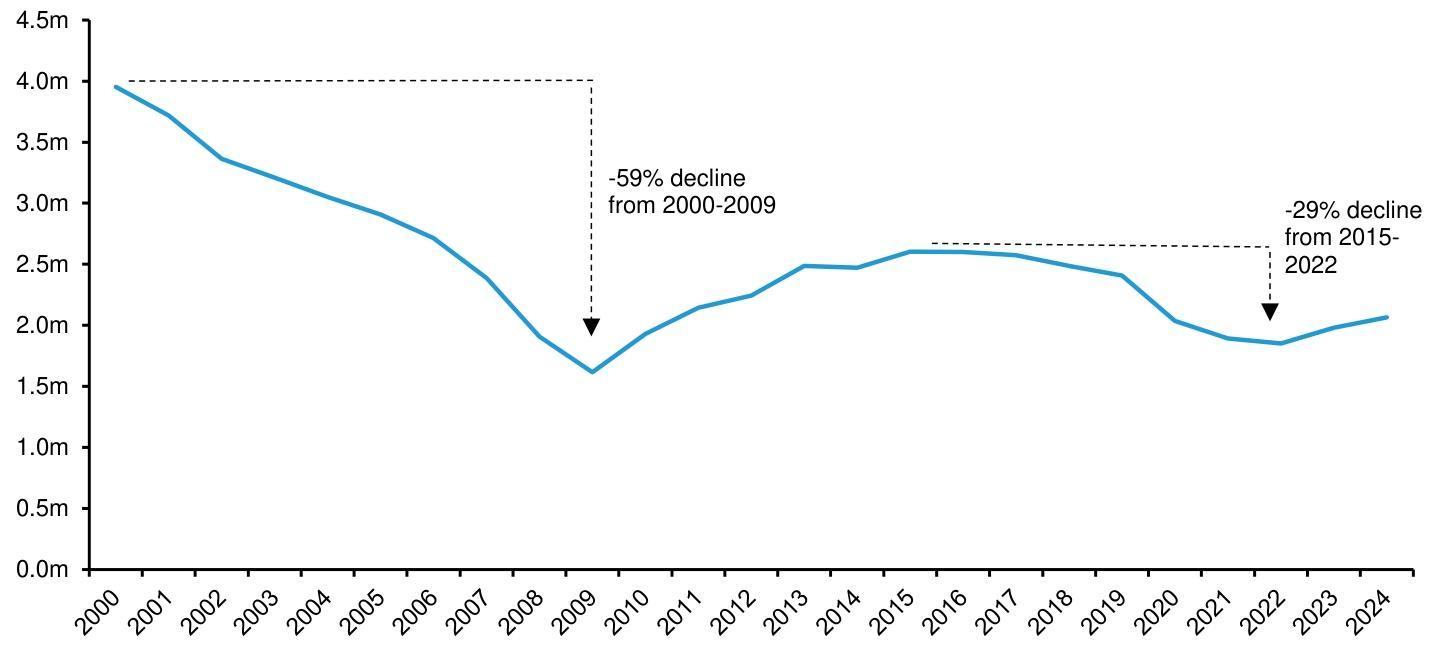
Source:IHS, Bernstein analysis
Strategic Focus Shift to EREV
In 2025, Ford will take Extended-Range EV(EREV) as its core strategic direction to address the cost and technical bottlenecks of large electric vehicles. This serves as a key strategy to compete against rivals like Tesla Cybertruck. The EREV technology charges a small battery pack with an internal combustion engine, preserving the pure electric driving experience while avoiding the high cost of batteries. Unlike the EU, the United States has no zero-emission requirements for new vehicle sales. At the federal level, the standards set by the Environmental Protection Agency link compliance bonuses to the electric driving range, indicating that EREV has potential advantages over Plug-in Hybrid EV(PHEV).
The EREV technology is especially suitable for large vehicles such as SUVs and pickup trucks. Paired with a large-capacity battery pack, the vehicle can maintain high traction capacity while achieving a comprehensive range of 700 miles (approximately 1,127 km), solving the "economic dilemma" of large electric vehicles caused by their weight and battery costs. McKinsey's analysis of the emerging EREV market shows that vehicles offering a pure electric range of 200 miles and a larger total range(over 500 miles) represent a blue ocean market. These vehicles can effectively meet the needs of most commuters and, at the same time, alleviate the "range anxiety" that some consumers have towards pure battery EVs.
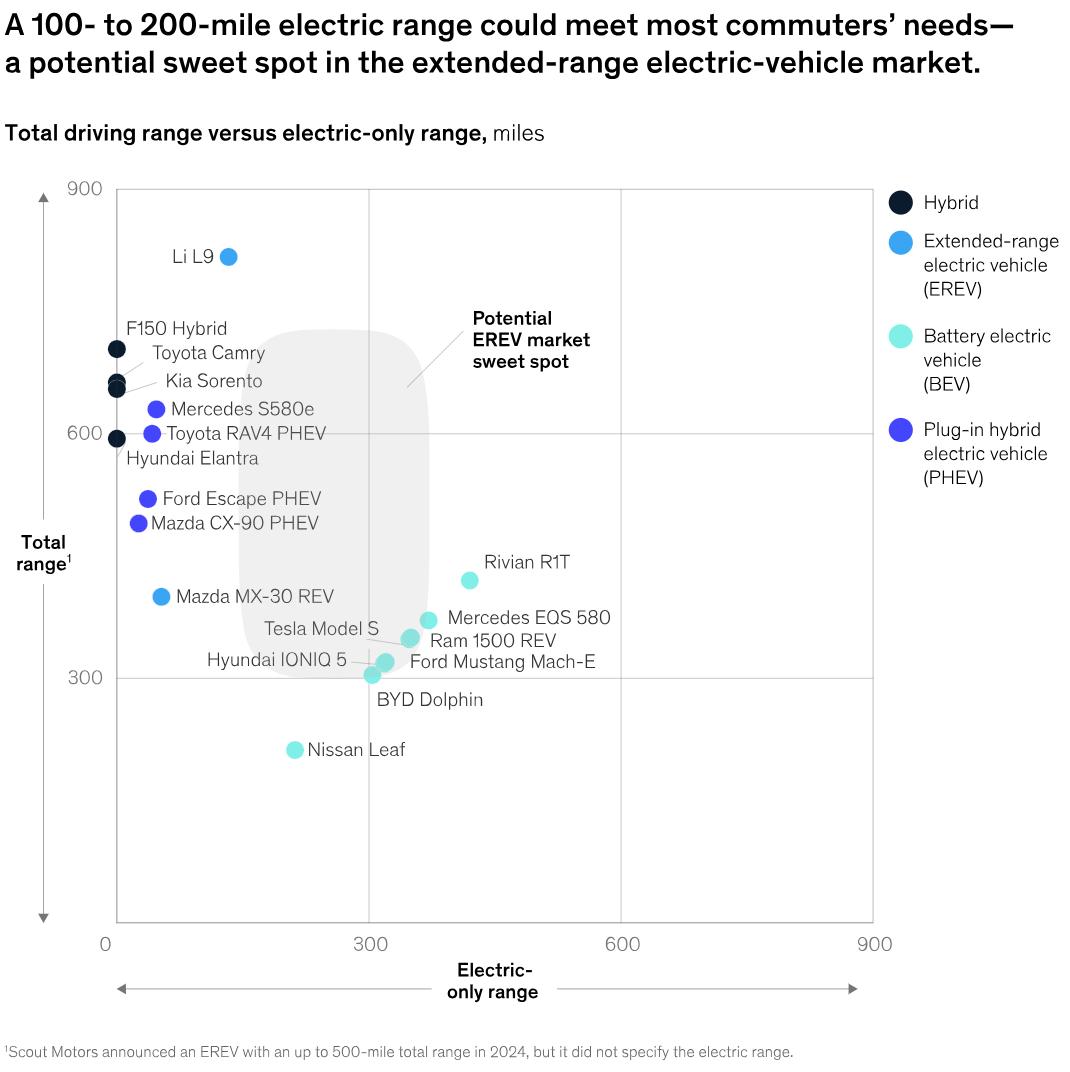
Source:McKinsey & Company
Ford has deep technical accumulation in the field of EREV. Technologically, Ford has partnered with CATL to develop batteries that combine sodium-ion and lithium-ion technologies, increasing the low-temperature range and reducing costs. The goal is to reduce the battery cost to $90 per kWh by 2026, while achieving a pure electric range of 400 kilometers and ultra-fast charging capabilities.
Ford is expected to fill the market gap between pure electric vehicles and fuel-powered vehicles through the EREV technology, especially establishing a differentiated advantage in the commercial vehicle and high-end pickup truck segments. Currently, Ford's Model e has seen a 35% decline in revenue, and the loss margin continues to expand, mainly due to high battery costs and substantial R&D investments. The company is transitioning to a low-cost platform and hybrid technology. It needs to make a transition through hybrid models, increase the sales volume of commercial electric vehicles, and reduce battery costs to achieve technological improvements. It is expected that a profit inflection point may be reached in 2026. If the goal of achieving a production capacity of 2 million EVs is met then, its global market share may rise to the top five. Whether Ford Motor can strike a balance among cost control, technological iteration, and global layout will determine whether it can break through in the new energy vehicle competition.
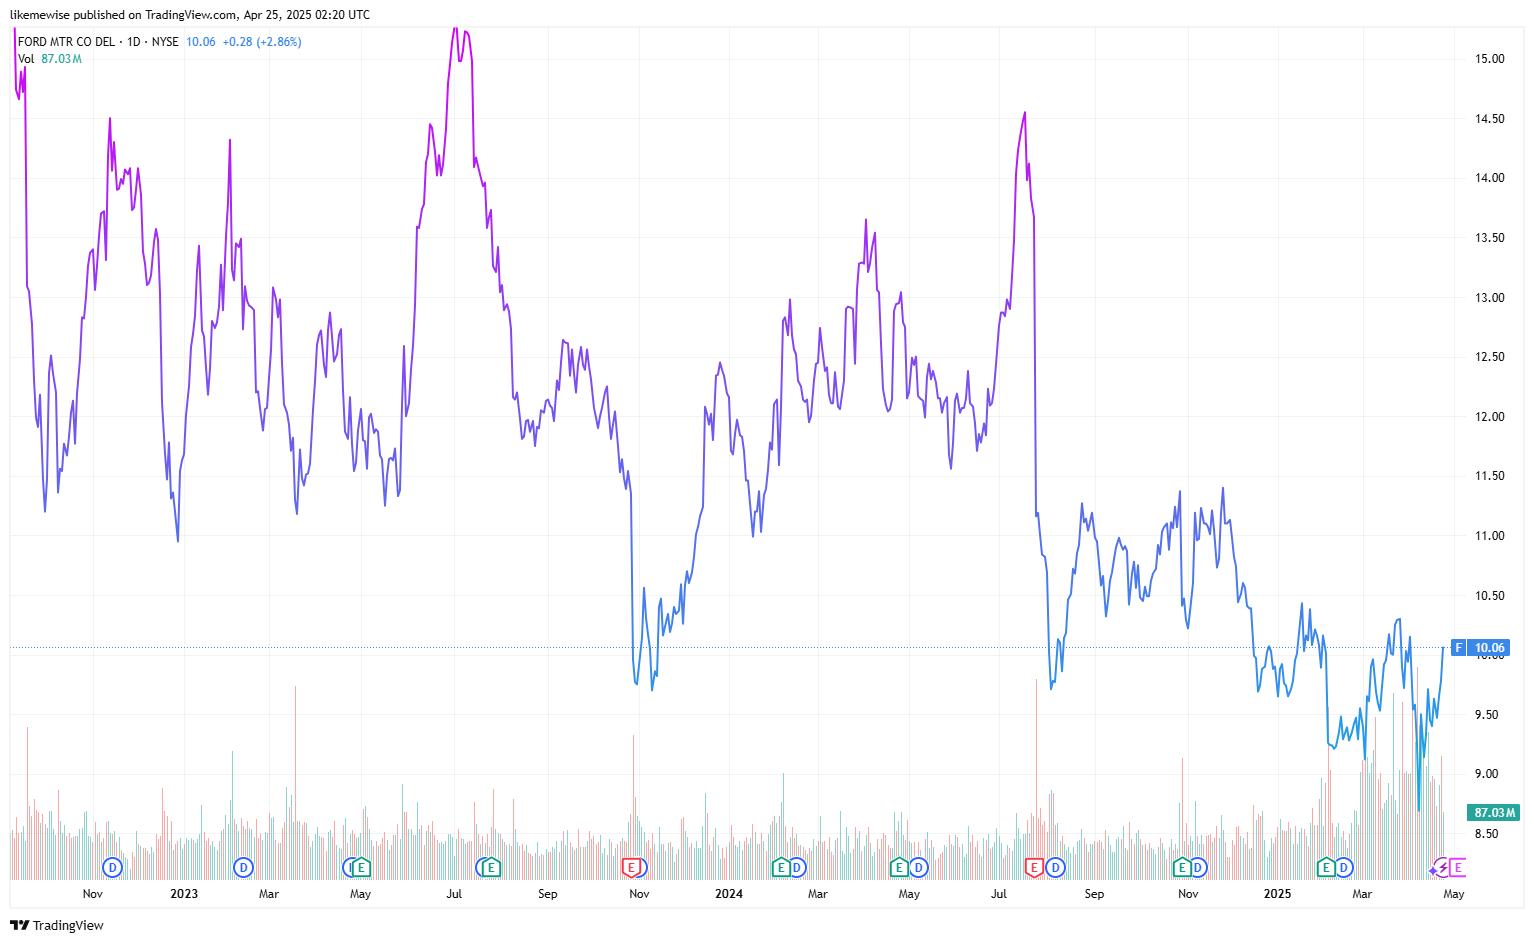
Financials and Valuation
Judging from Ford Motor's latest earnings report, its revenue increased by 5% year-on-year, and the net profit turned from a loss to a profit. The cash flow from operating activities and free cash flow have been continuously rising, and the cash reserve at the end of the year exceeded $28 billion. Ford's dividend payments appear secure in the next two years, supported by improved free cash flow and management's commitment to shareholder returns. This indicates that the company has strong operational and financial stability, but facing the pressure of transitioning to new energy vehicles.
The management plans to reduce net costs in 2025, focus on the modular platform (GE2) and localize the supply chain, and accelerate the layout of EREVs. The performance guidance ($7-8.5 billion) is significantly lower than analysts' expectations, mainly due to tariff and industry pricing pressure and losses in the electric vehicle segment.
Considering the situation of the United States imposing reciprocal tariffs, Ford, due to its reliance on the Mexican supply chain, has seen its gross profit margin eroded, leading to a 3% increase in costs and a potential 5% decline in sales. China's imposition of tariffs on the United States has affected the import costs of Ford's high-end models in China. However, a high localization rate (97.3%) can largely offset this impact. Overall, the imposition of tariffs may cause Ford Motor's profit growth rate to decline to around 0% in the next two years. Under the influence of the management's cost-cutting and accelerated new energy transformation strategies, the company's profit is unlikely to exceed analysts' expectations.
In terms of valuation, Ford currently has a P/E ratio of 6.6x, which is lower than the industry average of 7.0x, and its current valuation is in the bottom 25% of its historical range. The company's 6.5% dividend yield provides a margin of safety during the recession cycle. If the U.S. economy achieves a soft landing or there are targeted exemptions from tariffs, the stock price may rebound to $11-12, representing a potential upside of about 5-10% compared to the current price of $9.6.
2024Q4 | F | GM | STLA | TM | HMC | TSLA |
Company Name | Ford Motor Company | General Motors Company | Stellantis N.V. | Toyota Motor Corporation | Honda Motor Co., Ltd. | Tesla, Inc. |
Industry | Automobile Manufacturers | |||||
Gross Profit Margin | 8.40% | 12.35% | 13.31% | 18.67% | 21.49% | 17.86% |
EBIT Margin | 2.81% | 6.79% | 4.01% | 10.26% | 6.64% | 7.84% |
EBITDA Margin | 5.98% | 9.97% | 6.82% | 14.15% | 12.44% | 13.34% |
Net Income Margin | 3.18% | 3.21% | 3.49% | 10.91% | 4.79% | 7.26% |
ROE | 13.45% | 8.91% | 6.72% | 14.55% | 8.70% | 10.42% |
ROA | 4.24% | 4.70% | 2.62% | 4.00% | 3.34% | 5.28% |
Total Cash | 28.37B | 22.04B | 36.66B | 88.22B | 33.20B | 36.56B |
P/E (TTM) | 6.6 | 7 | 4.95 | 7.38 | 7.06 | 118.32 |
Price/Sales (TTM) | 0.21 | 0.27 | 0.17 | 0.8 | 0.34 | 7.9 |
EV/Sales (TTM) | 0.92 | 0.83 | 0.18 | 1.42 | 0.66 | 7.72 |
EV/EBITDA (TTM) | 15.43 | 8.34 | 2.69 | 10.01 | 5.32 | 57.89 |
Price to Book (TTM) | 0.85 | 0.71 | 0.32 | 1.03 | 0.55 | 10.65 |
Price/Cash Flow (TTM) | 2.48 | 2.2 | 6.54 | 8.66 | 14.01 | 52.03 |
Source: TradingKey, Refinitiv