[IN-DEPTH ANALYSIS] JPMorgan's Record-Breaking Year in 2024: Investments in Excellence

Source: TradingView
Executive Summary
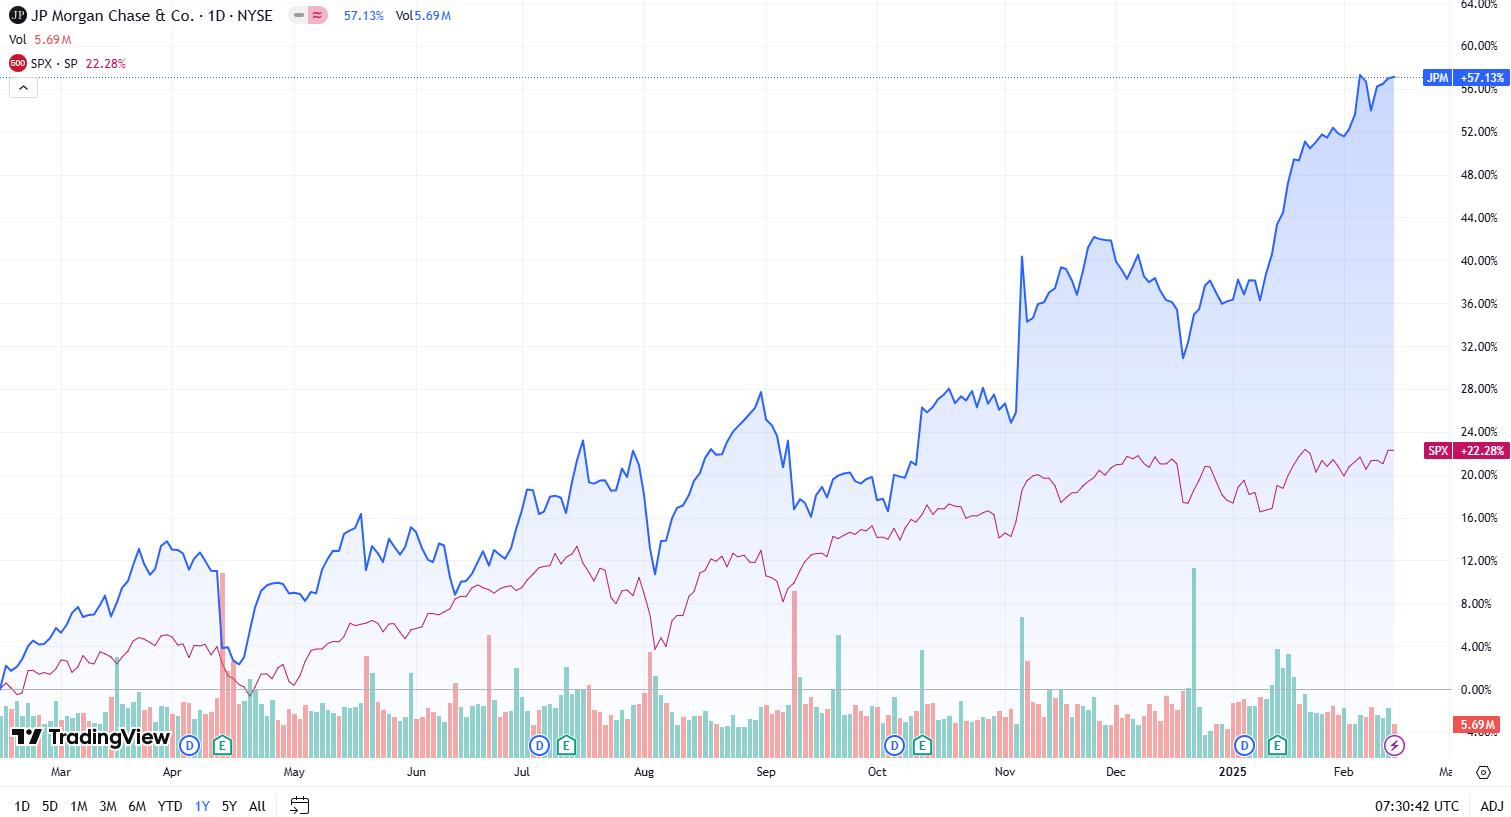
JPMorgan Chase, a cornerstone of global finance with over $4 trillion in assets, continues to set the bar in investment banking, commercial banking, asset management, and consumer services. JPMorgan has significantly outperformed the S&P 500 (SPX) over the past year, with a remarkable 57.13% increase in stock price, compared to SPX’s 22.28%.
JPMorgan’s consistent leadership in these sectors is reflected in its record-breaking 2024 earning performance. The diverse business model, particularly the strength of commercial and investment banking, positions JPMorgan as the dominant player in the U.S. banking industry.
JPMorgan boasts the largest market capitalization, valued at $773.38 billion—almost double that of its nearest competitor, Bank of America. The company also leads in both revenue growth (8.41% CAGR) and EPS growth (8.74% CAGR), while maintaining the highest net income margin at 35.06%. Its operational efficiency stands out with a 53% efficiency ratio, positioning it as the most cost-effective among its peers. Key revenue drivers such as Net Interest Income, Principal Transactions, and Investment Banking Fees continue to propel its growth, reinforcing JPMorgan's market dominance.
Company Overview
JPMorgan Chase & Co. (NYSE: JPM), one of the most influential financial institutions in the world, has been at the forefront of global financial innovation and development for over 200 years. As a global leader in investment banking, consumer banking, commercial banking, and asset management, JPMorgan Chase serves millions of customers across more than 160 countries. The company is recognized for its strong financial performance, innovative solutions, and ability to adapt to shifting market dynamics. With over $4.0 trillion in total assets and a robust market presence, JPMorgan Chase continues to excel in areas such as investment banking and wealth management, consistently securing leadership positions across its business segments.
JPMorgan’s Business Segments: Driving Record Growth and Profit
JPMorgan Chase's diverse business portfolio drives its resilience and growth. In 2024, the company achieved record revenues of $166.8 billion, with a net income of $56.9 billion, showcasing strong performance across all segments.
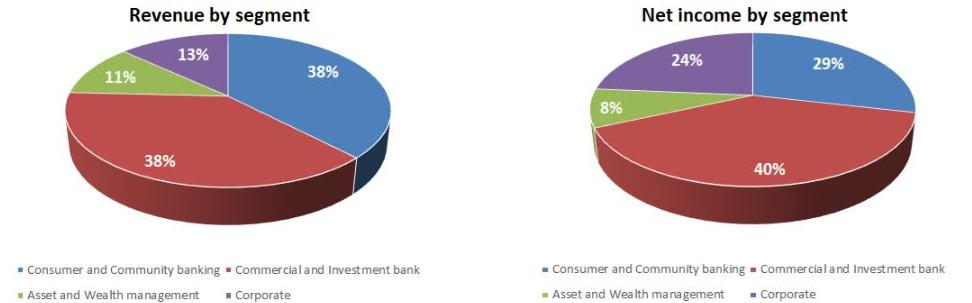
The company’s revenue is strategically balanced across its various business lines. Commercial and Investment Banking and Consumer and Community Banking each account for 38% of total revenue, while Asset and Wealth Management contributes 11%, and Corporate services make up 13%.
However, when it comes to net income, the story shifts. Commercial and Investment Banking takes the lead with 40%, while Consumer and Community Banking follows at 29%, Corporate stands at 24%, and Asset and Wealth Management rounds out the group with 8%. The sharp contrast in profitability underscores the dominance of the commercial and investment banking sectors in JPMorgan’s earnings. The company’s ability to effectively balance high revenue generation, cost management, and strategic investments has solidified its position as an industry leader.
Source: JPMorgan Chase & Co.
Industry Positioning----JPMorgan as the Unquestioned Leader
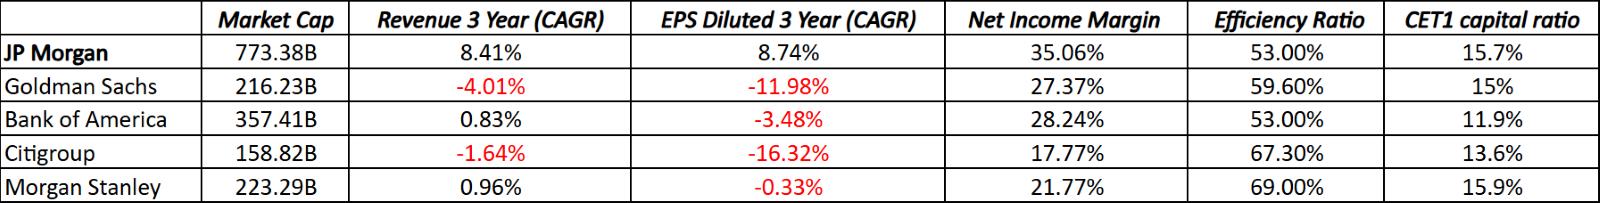
JPMorgan stands as the undeniable leader in the U.S. banking industry, outpacing its competitors across multiple key financial metrics. When comparing JPMorgan with major peers—Goldman Sachs, Bank of America, Citigroup, and Morgan Stanley—across Market Capitalization, Revenue Growth, EPS Growth, Net Income Margin, Efficiency Ratio, and CET1 Capital Ratio, the data demonstrate its market dominance in the U.S. banking landscape.
Source: TradingKey, SEC Fillings, Seeking Alpha
A Clear Winner: Market Capitalization
JPMorgan leads the size with a market capitalization of $773.38 billion, nearly double that of its closest rival, Bank of America ($357.41 billion). This vast scale provides JPMorgan with unmatched market influence, operational flexibility, and global reach.
JPMorgan's Growth Engine: Revenue Expansion
JPMorgan consistently outperforms its peers in terms of revenue growth, with an 8.41% CAGR over the past three years. This growth is significantly higher than Goldman Sachs, which has experienced a -4.01% decline, and Citigroup, with a -1.64% drop in revenue over the same period. Bank of America and Morgan Stanley show modest growth of 0.83% and 0.96%, respectively. This superior revenue growth underscores JPMorgan’s ability to capture market share across various sectors, from retail banking to investment banking, even in an increasingly volatile market.
Profitability: JPMorgan Shines in Net Income Margin
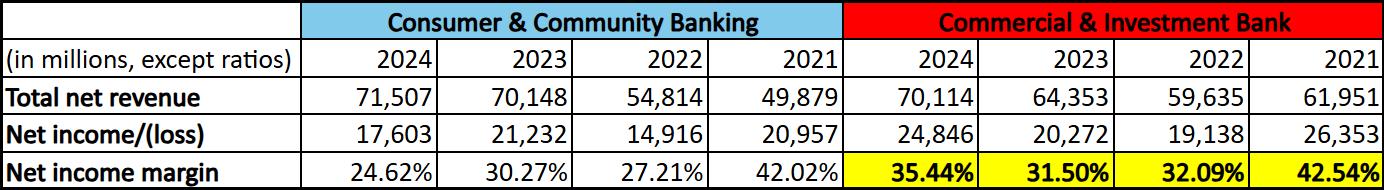
JPMorgan leads the industry in profitability, with an 8.74% EPS growth (CAGR) over the past three years, the bank demonstrates robust earnings expansion, outpacing its main competitors. In terms of net income margin, JPMorgan maintains a dominant 35.06%, significantly higher than Goldman Sachs (27.37%) and Bank of America (28.24%). Specifically, in the Commercial & Investment Bank (CIB) segment, JPMorgan has maintained a 35.44% net income margin, reflecting not only the significant revenue generated by the segment but also its ability to efficiently convert this revenue into profit.
This combination of strong earnings growth and exceptional profitability underscores JPMorgan’s ability to effectively convert revenue into profit, solidifying its position as the most efficient and profitable major bank in the U.S.
Source: TradingKey, SEC Fillings
Efficiency Matters: JPMorgan’s Operational Excellence
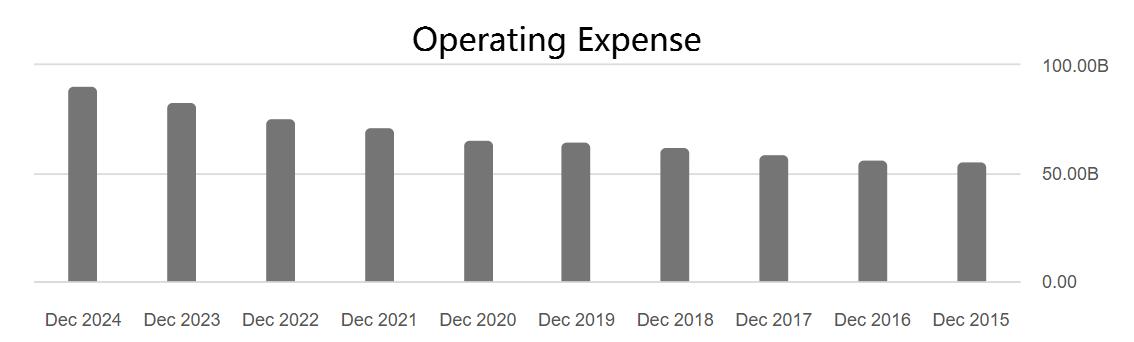
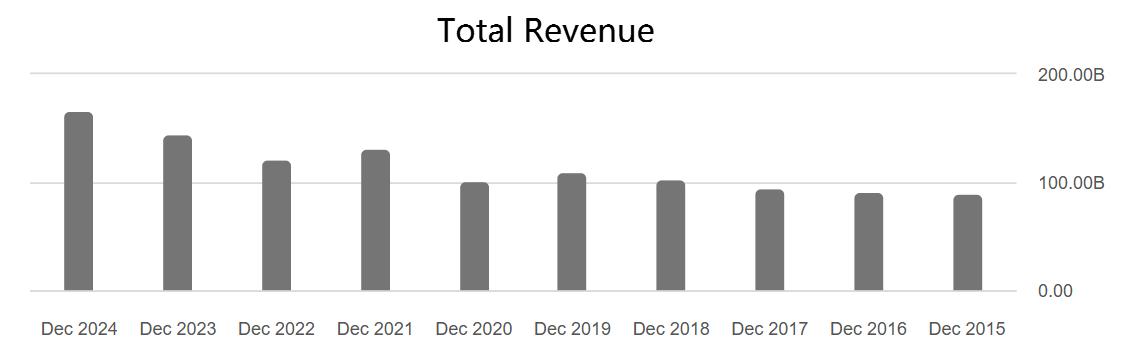
A key differentiator in assessing the operational efficiency of banks is the Efficiency Ratio, which measures how effectively a bank manages its costs relative to its income. JPMorgan Chase stands out with an impressive 53% efficiency ratio, underscoring its exceptional ability to control costs while generating substantial revenue. This efficiency is further highlighted by JPMorgan’s ability to maintain relatively stable operating expenses over time, as shown by the consistent year-over-year performance, while revenue growth has outpaced its peers, with a CAGR of 8.41% over the past three years.
In contrast, Goldman Sachs shows a higher ratio at 59.6%, indicating slightly lower cost efficiency, while Citigroup has an even higher ratio of 67.3%, reflecting further inefficiencies. Morgan Stanley fares the worst with a 69% efficiency ratio, signaling that it spends significantly more to generate its revenues than its competitors. JPMorgan's relatively lower efficiency ratio highlights its strong operational advantage, showcasing its ability to maximize output while maintaining superior cost control.
Source: Seeking Alpha
Source: Seeking Alpha
Capital Strength: JPMorgan's Robust Financial Foundation
JPMorgan Chase boasts a CET1 capital ratio of 15.7%, the second highest among its competitors, indicating robust financial health and the ability to withstand economic shocks. Goldman Sachs and Morgan Stanley are close behind at 15% and 15.9%, respectively. Citigroup and Bank of America lag with ratios of 13.6% and 11.9%, respectively, but still comfortably meet the minimum regulatory requirements. JPMorgan’s stronger capital base not only ensures its stability but also provides ample room for strategic investments and growth.
What’s Next? JPMorgan Revenue Drivers
JPMorgan’s revenue generation is deeply intertwined with macroeconomic trends and key financial indicators. Its business performance is influenced by factors such as interest rate, policy changes, market volatility, and shifts in consumer and institutional demand. Understanding how these elements interact with the bank’s core revenue streams provides insight into its financial resilience and growth potential. Here’s a breakdown of the key drivers behind JPMorgan’s diverse income sources.
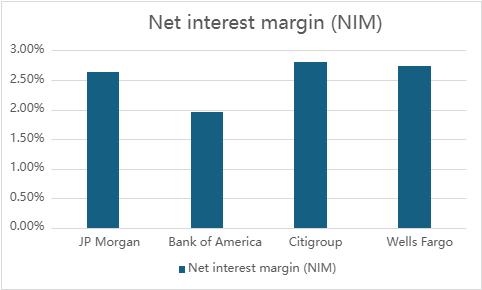
1. Net Interest Income
Net Interest Income (NII) is the largest revenue source for JPMorgan Chase, primarily derived from the interest rate spread on loans and deposits, including home loans, auto loans, and credit card loans, driven by the Net Interest Margin (NIM), which reflects the difference between loan interest rates and deposit rates. In 2024, JPMorgan's NIM stands at 2.63%, higher than Bank of America (1.95%) but slightly lower than Citigroup (2.80%) and Wells Fargo (2.73%). A higher NIM indicates strong profitability in managing interest rate spreads, particularly in consumer lending and credit cards.
JPMorgan expects their NII excluding Markets to be approximately $90 billion in 2025, driven by a decrease in rates and a forecasted dip in the second half of 2024, followed by recovery as rates stabilize. Currently, the market expects the Fed to cut interest rates twice in 2025, which could compress NIM and reduce NII, as loan rates would likely decrease faster than deposit rates. However, if disinflation trends stagnate and rate cuts are slower than expected, JPMorgan could maintain a higher NIM, sustaining NII growth. This scenario would benefit JPMorgan, especially in consumer lending and credit card services, where interest income is most sensitive to rate changes, assuming the economy continues to grow steadily in line with current market expectations.
Source: TradingKey, SEC Fillings
2. Principal Transactions
Principal transactions are JPMorgan Chase's second-largest revenue source, primarily generated from trading activities in stocks, bonds, and derivatives. The key drivers for this business include market volatility and trading volume. In times of increased volatility, trading opportunities expand, boosting revenue from this segment.
With relatively stable expectations for monetary policy and interest rates, policy uncertainty, particularly from the Trump administration’s potential regulatory shifts, could introduce more volatility. Deregulation or tariffs may encourage market activity, but it also increases unpredictability, which could impact trading volumes and market risk premiums. As a result, this could lead to fluctuating revenue in principal transactions, depending on how market sentiment reacts to evolving political and regulatory changes.
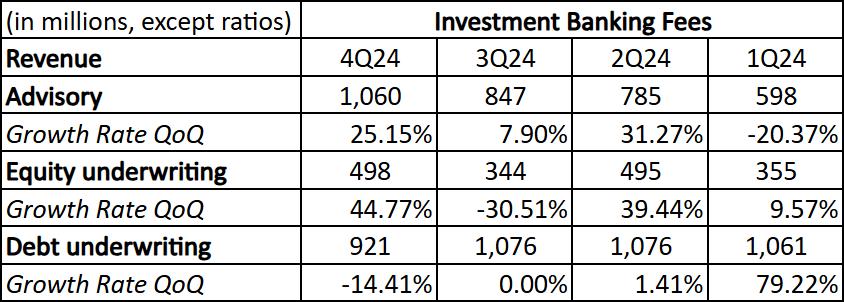
3. Investment Banking Fees
Investment banking is JPMorgan’s most profitable and highest-margin business. Investment banking fees primarily stem from mergers and acquisitions (M&A) and capital market financing activities such as IPOs and debt underwriting. In 2023, JPMorgan remained the global leader in investment banking, holding an 8.8% market share despite a slight decline in overall investment banking fees due to reduced market activity.
The key factors affecting this revenue are M&A activity and capital market financing demand. For example, in Q4 2024, advisory fees reached $1,060 million, with a growth rate of 25.15% quarter-over-quarter (QoQ). Equity underwriting revenue was $498 million, showing a 44.77% increase QoQ, while debt underwriting revenue was $921 million, though it saw a slight decline of -14.41% QoQ.
If the Fed continues to cut interest rates in 2025, it could benefit M&A activity, as lower borrowing costs make acquisitions more attractive. This would likely boost advisory revenues as more firms pursue mergers and acquisitions. The decline in interest rates could also make debt refinancing more appealing, potentially driving a rebound in debt underwriting. As financing costs decrease, companies might be more inclined to issue new debt, contributing to higher revenue in this segment.
Additionally, deregulation policies under the Trump administration, might stimulate market activity, particularly in capital markets and M&A transactions. Deregulation often leads to more M&A opportunities and a looser financing environment, which directly contributes to higher investment banking fees. For instance, in Q4 2024, debt underwriting saw a decline in growth, but a more favorable regulatory environment and lower rates could reverse this trend, leading to stronger performance in future quarters.
Source: TradingKey, SEC Fillings
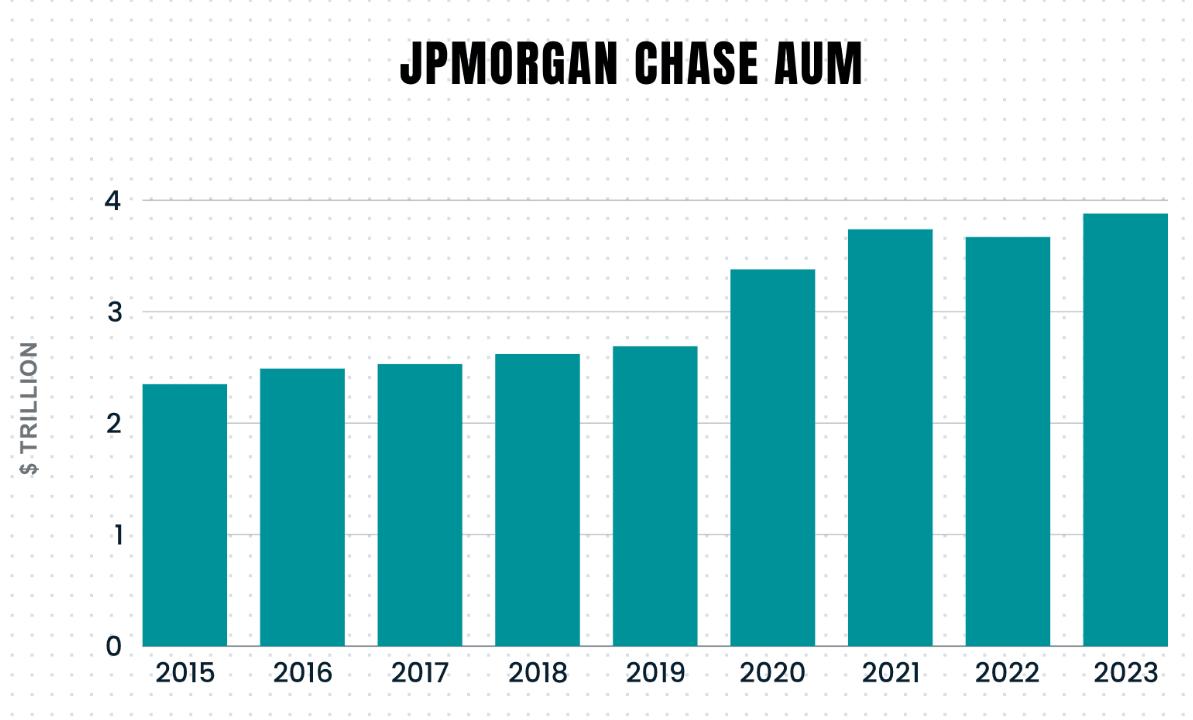
4. Asset and Wealth Management Fees
Asset and Wealth Management fees represent a significant revenue stream for JPMorgan, stemming from both wealth management services for high-net-worth individuals and asset management services for institutional clients and individuals. These services include investment portfolio management, retirement planning, private banking, and fund management.
The key drivers of this business are assets under management (AUM). JPMorgan's Assets Under Management (AUM) reached nearly $4 trillion in 2023, reflecting substantial growth over the past several years. This increase in AUM highlights JPMorgan’s strong position in both wealth management and asset management, as clients continue to entrust their assets to the company, especially during periods of strong market performance. In a loose financing environment, where interest rates are lower, investors often seek higher returns through riskier assets like equities and real estate, which can lead to more activity in asset management.
Source: cheddarflow
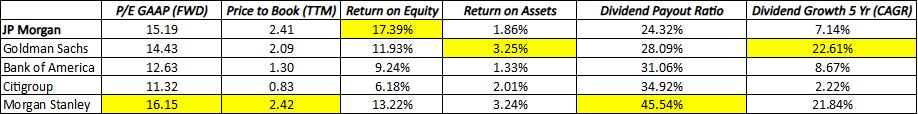
Valuation
JPMorgan’s current valuation suggests a strong position in comparison to its peers. With a forward P/E of 15.19, JPMorgan is trading at a moderate multiple, indicating reasonable market expectations for future earnings growth. Its P/B ratio of 2.41 shows that the market values JPMorgan at a premium compared to its book value, reflecting investor confidence in its asset quality and profitability.
JPMorgan's Return on Equity (ROE) of 17.39% is the highest among its peers, despite a relatively lower ROA, which is likely due to its use of debt to amplify its returns on equity, indicating strong profitability and efficient use of shareholder equity through leverage.
Additionally, Trump’s deregulatory policies may ease banking regulations, including lowering reserve requirements, which could release more liquidity into the market. This excess liquidity may benefit shareholders by enhancing returns, including dividends. While JPMorgan’s dividend payout ratio is relatively low, the historical trend shows that JPM has consistently adjusted its dividend payout over the years. With the implementation of deregulatory policies, JPMorgan’s dividend payout ratio has room for further increases, as the additional liquidity could allow the bank to allocate more towards shareholders.

Source: TradingKey, JPMorgan
Source: TradingKey, SEC Fillings, Seeking Alpha
Investment Outlook
JPMorgan’s record-breaking performance in recent quarters underscores its dominance in the financial sector, with strong performance in investment banking, asset management, and consumer banking. However, there are several risks to watch for in the near future. Tighter loan margins due to potential interest rate cuts, persistent inflation, and rising workforce dissatisfaction from mandates like the return-to-office policy could impact profitability and employee morale. Additionally, macroeconomic uncertainties and the potential slowdown in consumer spending and loan growth pose further risks to the bank's future performance. Despite these challenges, JPMorgan’s strategic focus on innovation and capital management positions it well for long-term stability and growth.
Base Case: Target Price = $294 (11% upside potential)
· PE Multiple: 15x, EPS: $19.6
· Reasoning: In the base case, we maintain the original EPS forecast of $19.6 for the next three years. The P/E ratio is set at 15x, reflecting stable economic growth and reasonable market conditions. The balance of interest rate cuts and deregulation under the Trump administration is expected to keep M&A and debt underwriting activities healthy, supporting a strong but stable growth outlook for JPMorgan.
Bull Case: Target Price = $395 (49.7% upside potential)
· PE Multiple: 19x, EPS: $20.8
· Reasoning: The bull case assumes that JPMorgan successfully leverages its AI-driven innovations, such as the COiN platform for legal document automation, the LOXM program for optimized trade execution, and IndexGPT for personalized investment advice. These technological advancements, alongside deregulation and a favorable interest rate environment, could lead to stronger-than-expected M&A and debt underwriting activity, further boosting revenues and profitability.
Bear Case: Target Price = $218.4 (17% downside potential)
· PE Multiple: 12x, EPS: $18.2
· Reasoning: The bear case reflects economic challenges, such as persistent inflation and reduced expectations for rate cuts, which could hurt investment banking activity and consumer demand. Additionally, regulatory hurdles, particularly related to Trump's deregulation policies not being fully realized, could dampen growth prospects, leading to a lower PE.