Quantitative Exchange Rate Forecasts


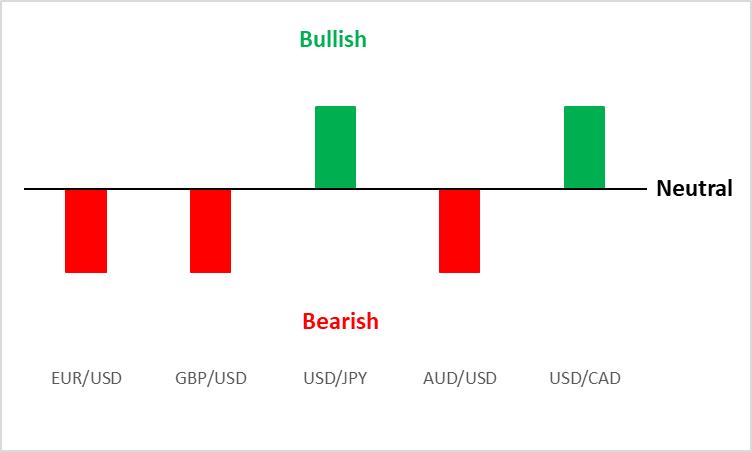
Executive summary: Short-term (0-3 months) view through quantitative analysis
Source: Tradingkey.com
1. Multi-factors
On 16 December, we released a report titled Exchange Rate Outlook: Time to Short the EUR/JPY Pair. Today, we delve further into the exchange rate markets with a quantitative analysis. Our quantitative exchange rate forecasting tool is based on econometric multi-factor regression models. This approach involves identifying and analysing the key factors that influence exchange rates. These factors include:
Exchange Rate Trends: Like other financial instruments, exchange rates exhibit their own historical and behavioural trends (Figure 1.1).
Figure 1.1: EUR/USD vs. leading EUR/USD
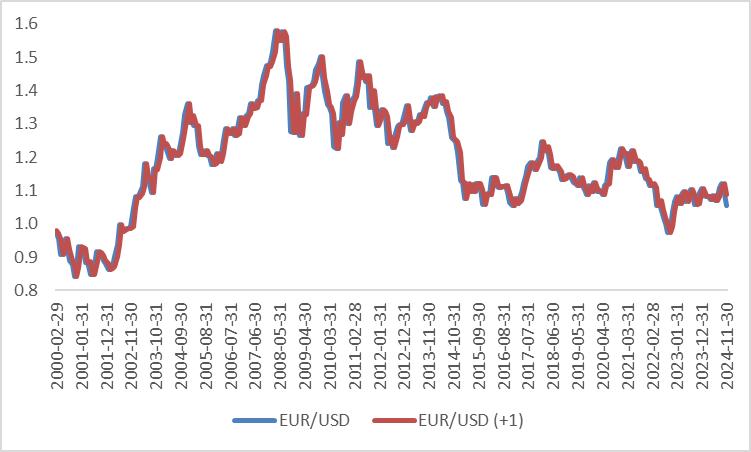
Source: Refinitiv, Tradingkey.com
Economic Growth Indicators: Metrics such as real GDP growth, Manufacturing PMI, Services PMI, Consumer Confidence Index, Business Confidence Index, and Investor Confidence Index reflect a country's economic strength. A robust economy typically supports currency appreciation.
Labor Market Conditions: Indicators like employment growth, participation rate, and unemployment rate highlight the stability and health of a country's labour market, which underpins monetary stability (Figure 1.2).
Figure 1.2: EUR/USD vs. unemployment rates
Source: Refinitiv, Tradingkey.com
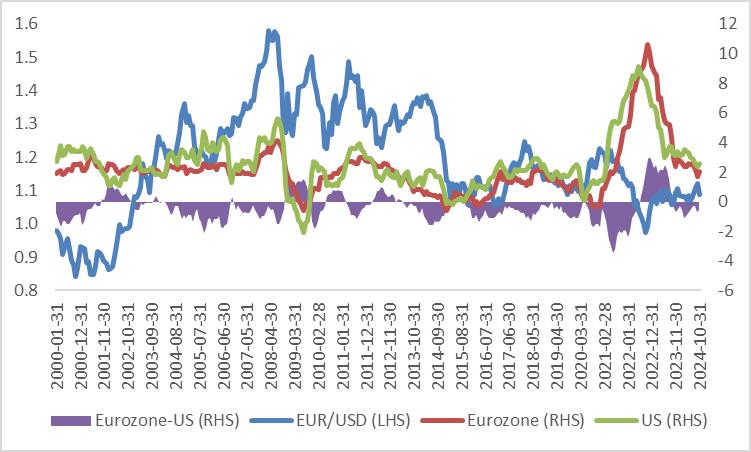
Inflation Measures: The increase in inflation metrics (e.g., CPI, core CPI, PPI, RPI) may prompt central banks to raise interest rates, benefiting the exchange rate. However, prolonged inflation can lead to the domestic depreciation of the currency outspreading to the international market, resulting in the exchange rate depreciation in the medium and long term (Figure 1.3).
Figure 1.3: EUR/USD vs. CPI
Source: Refinitiv, Tradingkey.com
Foreign Trade and Investment: Variables such as trade surplus/deficit, balance of payments, inward portfolio investment, and inward FDI show how cross-border trade and investments influence exchange rate movements. Net export growth and increased inward investment generally support currency appreciation.
Fiscal Policy: Factors like government consumption, investment, tax revenue, fiscal deficit, and debt levels impact currency value. While short-term government expenditure may stimulate the economy and strengthen the currency, long-term fiscal deficits or rising debt can erode confidence, putting downward pressure on the exchange rate.
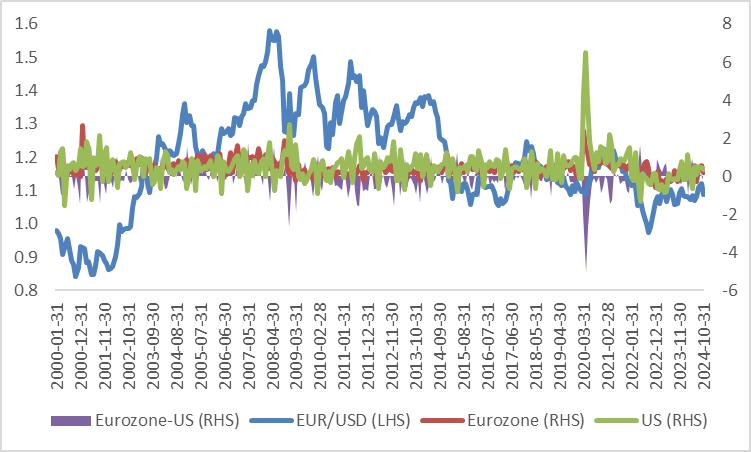
Monetary Policy: Central bank actions, such as adjustments in policy interest rates, quantitative easing (QE), or tightening (QT), influence capital flows. Easing monetary policy typically causes capital outflows to higher-yielding markets, reducing domestic currency demand and depreciating its value (Figure 1.4).
Figure 1.4: EUR/USD vs. M2 growth
Source: Refinitiv, Tradingkey.com
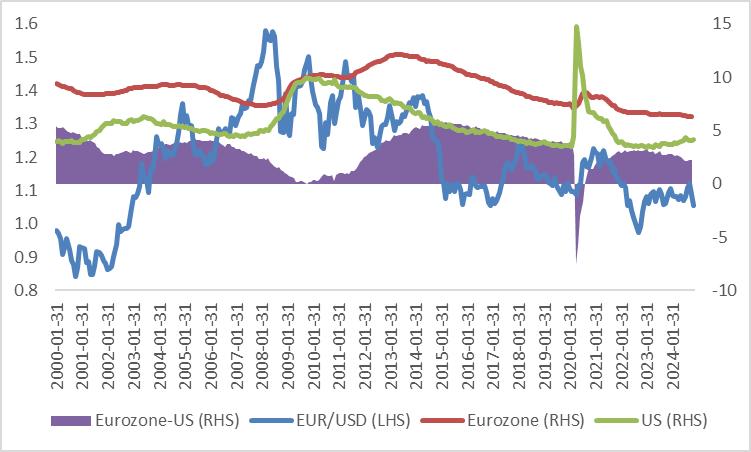
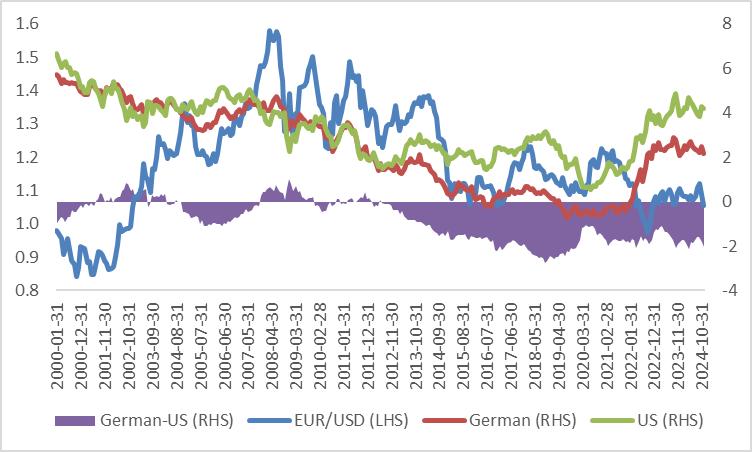
Financial Markets: Indicators such as interbank lending rates and 10-year Treasury yields demonstrate the strong positive relationship between market interest rates and exchange rates (Figure 1.5). Booming stock markets can also attract capital inflows, bolstering currency value.
Figure 1.5: EUR/USD vs. 10Y government bond yields
Source: Refinitiv, Tradingkey.com
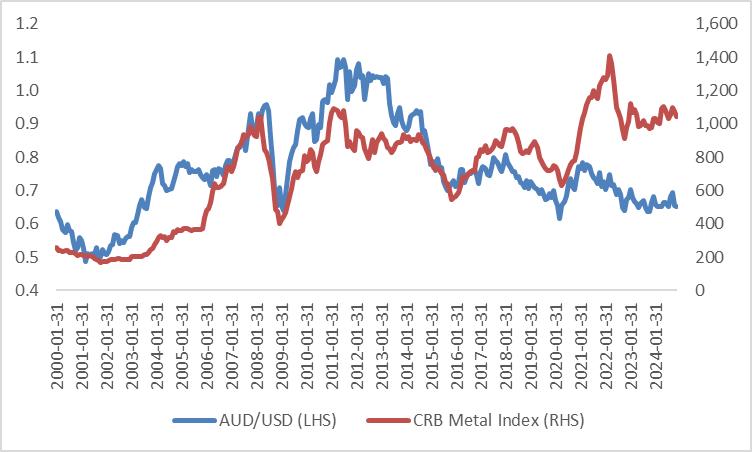
Commodity Prices: The value of commodity currencies is closely tied to commodity prices. For example, the Australian dollar is influenced by iron ore and coal prices, while the New Zealand dollar correlates positively with agricultural prices (Figure 1.6).
Figure 1.6: AUD/USD vs. Metal prices
Source: Refinitiv, Tradingkey.com
2. Model Development Process
· General Model Creation: We first incorporated all the above-mentioned economically meaningful variables into the model, forming a comprehensive or "General" model.
· Model Optimization: Using the General-to-Specific (GTS) method, we refined the model. This approach applies statistical tests (e.g., R2, F-test, t-test, p-value) to remove statistically insignificant variables, ensuring a robust model.
o R²: The explanatory power of the independent variable(s) in the model. For example, R² = 0.9 means that 90% of the variation in the dependent variable can be explained by the independent variables.
o F-test: Used to test whether the overall model is statistically significant, specifically evaluating if all the independent variables together significantly explain the variation in the dependent variable.
o t-test: Assess whether individual coefficients (parameters) in the model are significantly different from zero, indicating their contribution to explaining the dependent variable.
o p-value: The probability of observing the data (or something more extreme) given that the null hypothesis is true. A low p-value (typically < 0.05) indicates strong evidence against the null hypothesis.
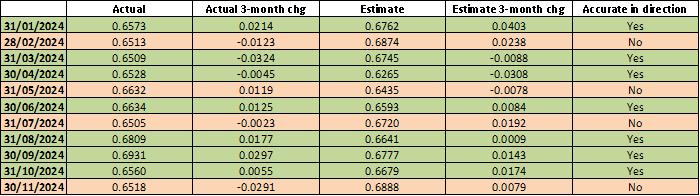
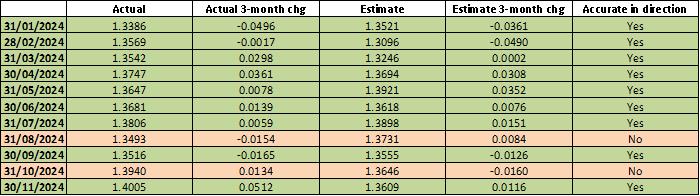
· Coefficient Calculation and Backtesting: With 20 years of historical data, we calculated the model coefficients. Our backtesting revealed a predictive accuracy of 64%-82% in directions in the current year (Figures 2.1-2.6).
· Forecasts: Based on our refined models, we project that the major currencies will depreciate against the US dollar by the end of March 2025.
Figure 2.1: Backtesting ranking (January 2024 – November 2024)
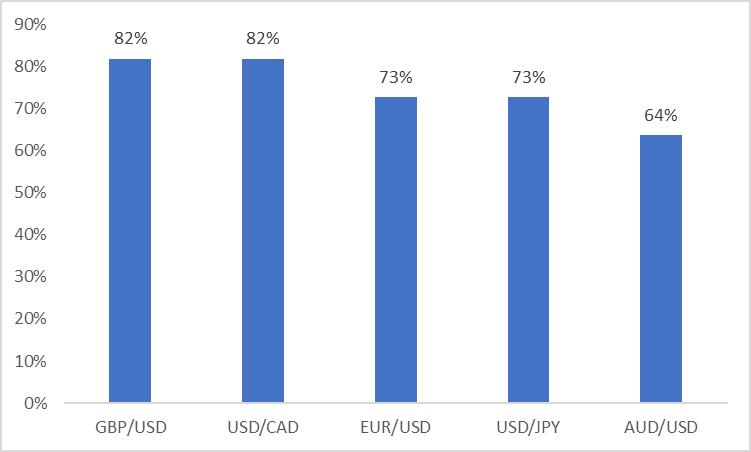
Source: Refinitiv, Tradingkey.com
Figure 2.2: Backtesting EUR/USD
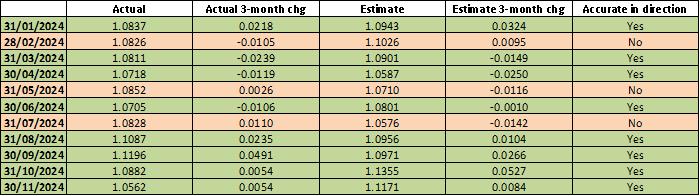
Source: Refinitiv, Tradingkey.com
Figure 2.3: Backtesting GBP/USD
Source: Refinitiv, Tradingkey.com
Figure 2.4: Backtesting USD/JPY
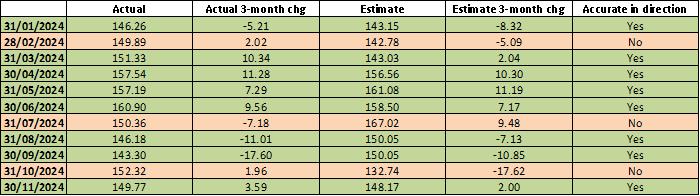
Source: Refinitiv, Tradingkey.com
Figure 2.5: Backtesting AUD/USD
Source: Refinitiv, Tradingkey.com
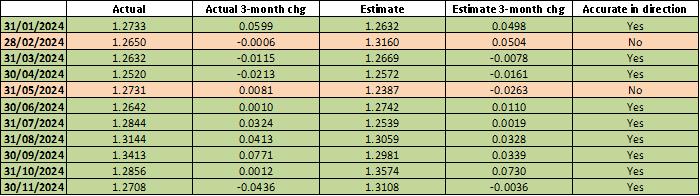
Figure 2.6: Backtesting USD/CAD
Source: Refinitiv, Tradingkey.com