What is a Steepening Yield Curve? How to Choose Short-Term and Long-Term U.S. Treasury ETFs?

Introduction
TradingKey - Backed by the dominance of the U.S. dollar and the robust economic strength of the United States, the U.S. bond market is the largest, most liquid, and most widely recognized fixed-income market in the world, with U.S. Treasuries as its cornerstone.
U.S. Treasuries are universally regarded as the "king of safe-haven assets," offering "risk-free returns" during periods of economic crises, financial turmoil, and geopolitical conflict. Compared to other safe-haven instruments—such as gold, the Japanese yen, the Swiss franc, or sovereign bonds from different countries—U.S. Treasuries stand out for their superior price stability and liquidity.
When discussing U.S. Treasury performance, Wall Street typically focuses on the movements of 2-year and 10-year Treasury yields, which represent short-term and long-term bonds, respectively. These two segments do not always move in tandem. During the Biden administration, the U.S. Treasury market experienced the longest yield curve inversion in history. Under the current Donald Trump 2.0 administration, however, "steepening of the yield curve" has emerged as a prominent theme.
Why Invest in U.S. Treasuries?
U.S. Treasuries are sovereign debt instruments issued by the U.S. Department of the Treasury and account for approximately 60% of the U.S. bond market—which includes Treasuries, mortgage-backed securities(MBS), corporate bonds, and municipal bonds.
As of March 2025, total U.S. Treasury debt stood at$36.21 trillion. The Congressional Budget Office (CBO) projects this figure could rise to $54 trillion by 2035, driven by an aging population and rising federal healthcare expenditures.
Global investors and central banks purchase U.S. Treasuries primarily due to their high liquidity, safety, the backing of the U.S. dollar's dominance, and safe-haven characteristics.
1. High Liquidity: The U.S. Treasury market is vast and serves as a global financial benchmark. Buying or selling Treasuries is relatively easy, offering investors flexibility in capital allocation.
2. High Safety: U.S. Treasuries are essentially IOUs from the U.S. government, backed by the country’s strong economic foundation and tax revenue base.
3. Dollar Dominance: Treasuries are denominated in U.S. dollars, which account for about 60% of global foreign exchange reserves—reinforcing their status as a globally trusted asset.
4. Safe-Haven Characteristics: Treasuries offer relatively stable returns, especially during periods of financial market volatility. In comparison, gold tends to be more volatile, and the trading volumes of Japanese yen and Swiss franc are significantly smaller than those of Treasuries. Other sovereign bonds often lack the same level of safety and liquidity.
However, investing in U.S. Treasuries is not without risks. Key concerns include fiscal sustainability due to rising debt levels (credit risk), the impact of Federal Reserve rate adjustments on bond prices (interest rate risk), and challenges posed by the global trend of de-dollarization.
Factors Influencing U.S. Treasury Price
According to bond pricing models, bond yields and bond prices have an inverse relationship. When analyzing bond prices, we often focus on yield trends, which are influenced by policy decisions, economic fundamentals, and market sentiment.
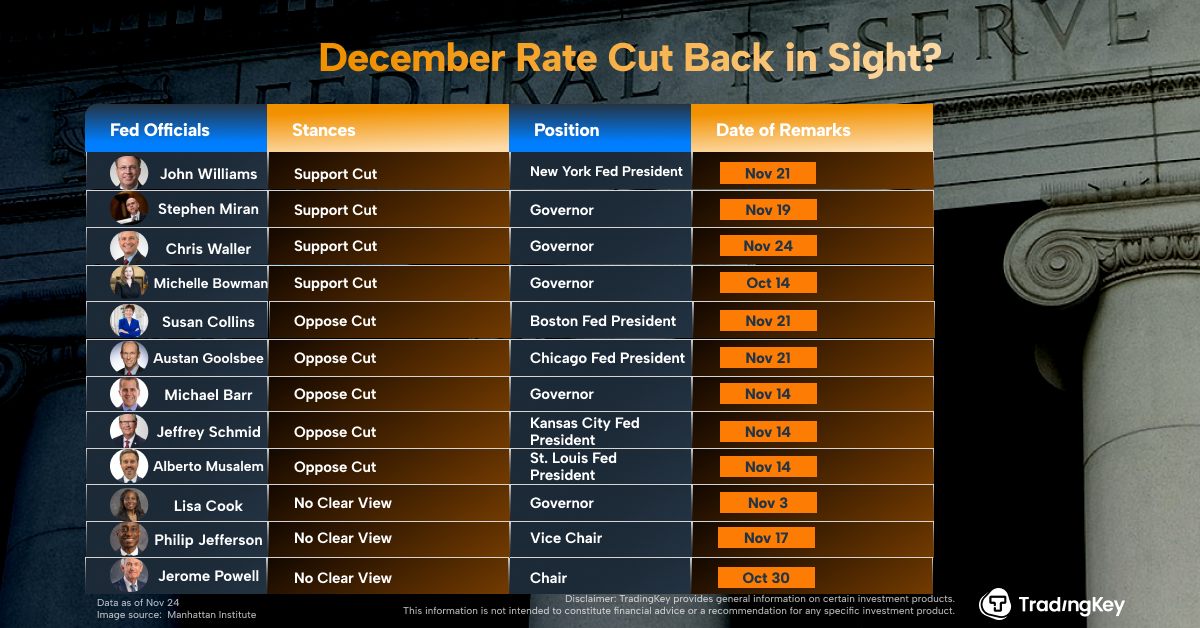
1. Federal Reserve Monetary Policy
- Rate hikes or quantitative tightening (QT): Treasury yields tend to rise.
- Rate cuts or quantitative easing (QE): Treasury yields tend to fall.
2. Economic Growth Expectations
- Strong growth: Investors favor riskier assets, leading to higher yields.
- Weak growth: Demand for safe-haven assets increases, lowering Treasury yields.
3. Inflation Expectations
- Rising inflation: Triggers expectation of Fed rate hikes. For example, during the "Bidenflation" period (mid-2022 to late 2024), the Fed raised rates 11 times, pushing the 10-year yield to nearly 5%.
- Falling inflation: Triggers expectation of Fed rate cuts. For instance, after inflation subsided in late 2024, the Fed began cutting rates in September, driving yields below 3.6%.
4. Treasury Supply
- Rising fiscal deficits increase the supply of Treasuries, which raises yields and lowers bond prices.
- Debt ceiling uncertainty can increase volatility and drive yields higher.
5. U.S. Dollar Strength
- A stronger dollar attracts foreign capital into Treasuries, lowering yields.
- A weaker dollar reduces foreign demand for Treasuries, raising yields.
6. Market Sentiment
- Risk-off sentiment: Investors seek safety in Treasuries, pushing yields lower.
- Risk-on sentiment: Investors shift toward riskier assets, reducing demand for Treasuries and pushing yields higher.
What is Yield Curve Steepening?
The U.S. Treasury yield curve plots interest rates across different maturities (e.g., 3 months, 2 years, 10 years, 30 years). It reflects market expectations for U.S. economic growth, inflation, and changes in monetary policy.
Typically, longer-term maturities carry higher yields due to greater risks such as inflation, default, or interest rate fluctuations (commonly referred to as duration risk). When short-term yields exceed long-term yields, the yield curve becomes inverted.
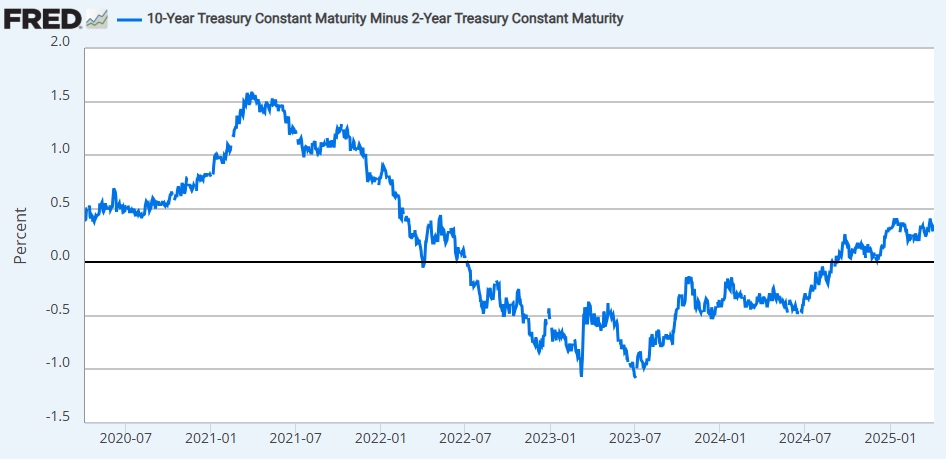
10-2 Year Treasury Yield Spread, Source: St. Louis Fed
Yield Curve Dynamics:
- Steepening: The gap between short-term and long-term yields widens.
- Flattening: The gap narrows.
Steepening and flattening are relative changes in the shape of the yield curve and do not necessarily indicate an inversion. Yield curve shifts are generally categorized into four types:
Type | Performance | Background | Example |
Bear Steepening | Short-term yields rise less than long-term yields. | Strong growth, high long-term inflation risks. | Post-pandemic recovery (2010). |
Bull Steepening | Short-term yields fall more than long-term yields. | Weak growth, urgent Fed rate cuts. | 2008 financial crisis; early 2020 pandemic. |
Bear Flattening | Short-term yields rise more than long-term yields. | Slowing growth, high inflation, and strong rate hike expectations. | 2018 Fed rate hike cycle. |
Bull Flattening | Short-term yields fall less than long-term yields. | Deteriorating economic outlook, strong demand for long bonds. | 2019 U.S.-China trade war. |
Source: TradingKey
Short-Term vs. Long-Term Treasury Investment
To predict whether the yield curve will steepen or flatten, it is essential to evaluate how economic and political factors differentially affect short-term and long-term bonds.
- Short-Term Bonds: Closely correlated with the Fed’s benchmark rate (the federal funds rate), they are highly sensitive to monetary policy decisions and Fed communication.
- Long-Term Bonds: Influenced more by expectations for long-term economic growth and inflation, and require a broader macroeconomic assessment.
In essence,, short-term Treasuries reflect risk aversion and liquidity preferences, while long-term Treasuries reflect market confidence in the U.S. economy’s future prospects.
Scenario | Preferred Bond Type | Reason |
Economic recession/slump | Long-term bonds | Increased safe-haven demand, expectations of rate cuts. |
Economic recovery/boom | Short-term bonds | Long-term bonds may fall sharply as real rates rise. |
High inflation | Short-term bonds | Minimize erosion of purchasing power. |
Low inflation/deflation | Long-term bonds | Higher real yields. |
Fed easing policy | Long-term bonds | Lower rates boost long-bond prices. |
Fed tightening policy | Short-term bonds | Less volatility, flexible reinvestment. |
Source: TradingKey
Recommended Treasury ETFs
For retail investors, Treasury ETFs offer a low-barrier, user-friendly, and flexible way to invest.
- Short-Term Treasury ETFs
- BIL ETF: SPDR Bloomberg 1-3 Month T-Bill ETF. Minimal duration risk, highly liquid, akin to cash. Best for: Rapid Fed rate hikes, volatile markets.
- SHY ETF: iShares 1-3 Year Treasury Bond ETF. High liquidity, suitable for conservative investors. Best for: Fed rate hikes, economic uncertainty.
- Intermediate Treasury ETFs
- IEI ETF: iShares 3-7 Year Treasury Bond ETF. Balances higher return potential with lower risk. Best for: Uncertain markets seeking moderate returns.
- IEF ETF: iShares 7-10 Year Treasury Bond ETF. Similar to IEI but with slightly longer maturities.
- Long-Term Treasury ETFs
- TLT ETF: iShares 20+ Year Treasury Bond ETF. High duration, significant price volatility. Best for: Expectations of Fed rate cuts, hedging stock market declines.
- Broad-Based Bond ETFs
- AGG ETF: iShares Core U.S. Aggregate Bond ETF. Includes 40%-50% Treasuries, 20%-30% agency bonds, and 20%-30% corporate bonds. Best for: Fed easing cycles or economic downturns.
- BND ETF: Vanguard Total Bond Market ETF. Similar to AGG but with higher liquidity.
- Leveraged and Inverse Treasury ETFs
For advanced investors, leveraged and inverse ETFs provide amplified exposure or hedging opportunities.
- Leveraged ETFs: ProShares UBT (2x long), Direxion TMF (3x long).
- Inverse ETFs: ProShares TBF (short), ProShares TBT (2x short), Direxion TMV (3x short).