That V-Shaped Reversal? Blame This Overlooked Indicator


Stock market experienced a V-shaped reversal. Has the panic dissipated?
TradingKey - U.S. stocks opened lower in premarket trading yesterday as ongoing concerns over tariff-policy continued to weigh on market sentiment, with the Nasdaq Composite briefly plunging more than 2.7%. However, dip-buying emerged as the session progressed, easing panic-driven selling. The major indexes staged a broad recovery, and the Dow Jones Industrial Average leading the rebound and closing in positive territory.
Yet one often-overlooked indicator played a key role in the U.S. stock market’s intraday V-shaped reversal: the Chicago PMI. The March reading came in at 47.6, up from 45.5 previously and well above the consensus forecast of 45.4. While still below the 50 threshold that separates expansion from contraction, the sharp rebound in this leading manufacturing gauge eased fears that the U.S. economy might be sliding into a deeper slowdown. This explains why the Dow Jones Industrial Average—whose components are more heavily tied to traditional U.S. industries, energy, and manufacturing—outperformed its peers.
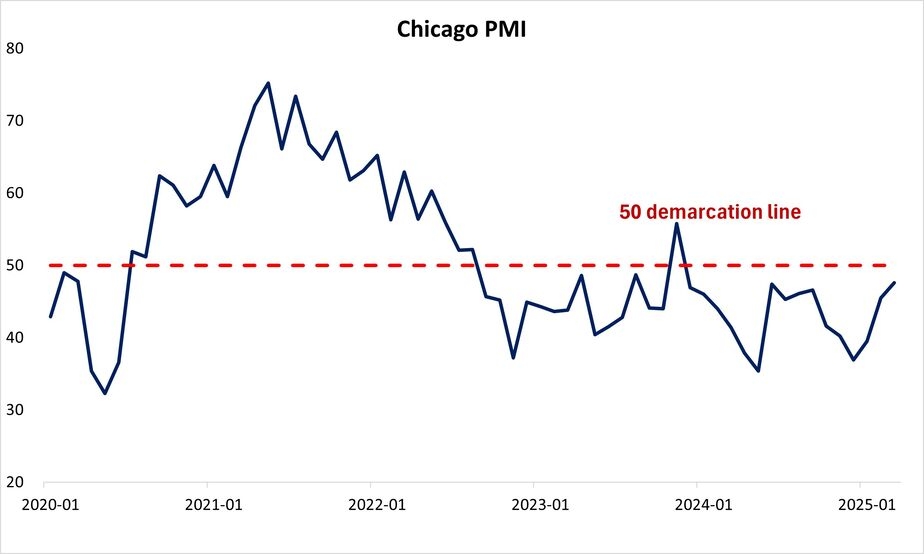
Data Sources: Reuters, TradingKey As of: April 1, 2025
Is the Manufacturing PMI Really Useful for Trading U.S. Stocks?
As noted in the table below, unlike the Chicago PMI, the U.S. ISM Manufacturing PMI garners far broader attention. While the Chicago PMI focuses primarily on the Chicago region, the ISM survey covers more than 400 manufacturing firms across 18 industries nationwide, offering a more comprehensive snapshot. Like its Chicago counterpart, the ISM PMI is composed of five key sub-indices: new orders, production, employment, supplier deliveries, and inventories.
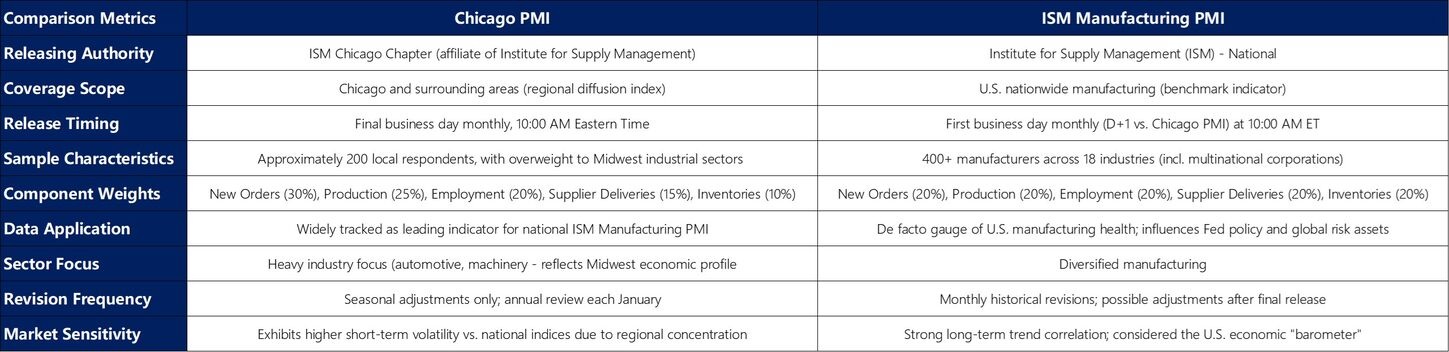
Data Sources: Reuters, TradingKey As of: April 1, 2025
Often dubbed the 'barometer' of the U.S. economy, the ISM Manufacturing PMI is widely regarded as a leading economic indicator. But does it truly hold predictive power for the stock market?"
Our Analysis: Manufacturing PMI as a Market Predictor
Using data from January 2016 through February 2025, we conducted a regression analysis examining the relationship between manufacturing PMI figures and concurrent S&P 500 performance. We constructed a basic time-lag sequence model: SPX(t) = β₀ + β₁×PMI(t-k) + ε(t).
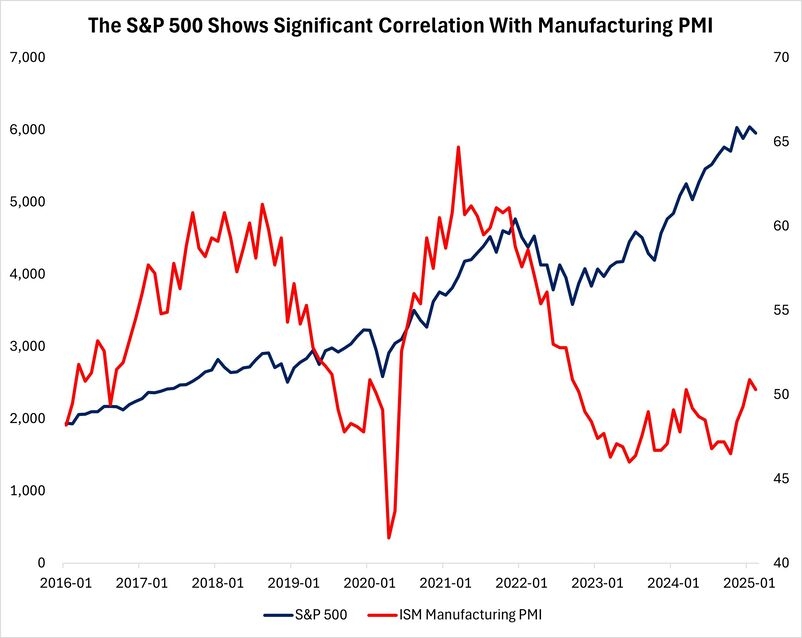
Data Sources: Reuters, TradingKey As of: April 1, 2025
The findings reveal a strong correlation between PMI data and S&P 500 movements during this period. Notably, the PMI index with a one-period lag demonstrated relatively significant predictive power for the benchmark stock index's performance.
The Logic Behind the Correlation: Why PMI Matters for Markets
There is, in fact, a clear economic rationale for this strong statistical relationship. The manufacturing PMI reflects changes in business orders, production, employment, and inventory levels. When the PMI is high, it typically signals robust order books, expanding production activity, and improved earnings expectations—all of which tend to drive stock prices higher. Conversely, a low PMI often points to weak demand, slowing production, and deteriorating profit outlooks, which can weigh on equity markets. Among the subcomponents, new orders and employment indicators tend to have the most pronounced impact on subsequent market performance.
For investors, monitoring the monthly ISM Manufacturing PMI release can provide valuable insights for positioning. However, it’s important to note that short-term stock market movements are influenced by a complex web of factors—ranging from Fed policy to geopolitical risks—meaning the PMI, as a relatively low-frequency monthly indicator, should not be used in isolation as a trading signal.
Back to the Present: Will Today’s ISM PMI Follow Chicago’s Lead?
All eyes now turn to the ISM Manufacturing PMI—the heavyweight champion of U.S. factory gauges—due out later today. After Chicago’s PMI staged a surprise comeback (47.6 vs. 45.4 expected), the big question is: Will the ISM play copycat?
And more importantly—if it delivers an upside surprise, can we expect Wall Street’s rebound party to keep tonight? Or will this be another "buy the rumor, sell the news" fizzle? Place your bets, folks. The machines (and the Fed whisperers) are watching.