

Dow Jones Industrial Average goes flat on Friday after volatility-tinged week

- Dow Jones is set to end the week close to where it started.
- The major equity index recovered after Monday's thousand-point plunge, but nothing more.
- Markets now pivot to focus on next week’s inflation data.
The Dow Jones Industrial Average (DJIA) is trading mostly flat on Friday, testing the water near the week’s opening bids after a run of volatility sparked by broad-market concerns that the Federal Reserve (Fed) might have missed the train on rate cuts. A turn towards the softer side in US data prints late last week sparked a risk-off plunge across the global markets, coupled with an unwinding of the Yen carry trade after the Bank of Japan (BoJ) ended favorable rate differentials.
Forecasting the Coming Week: US CPI and Fed’s easing should rule the sentiment
After kicking off the trading week with a thousand-point plunge, the Dow Jones is back to where it started, paddling around 39,400.00. Investor hopes for an “emergency rate cut” from the Fed failed to materialize after markets realized that six-digit US Nonfarm Payrolls jobs growth, unemployment below 5%, steady wage growth, and week-on-week jobless claims within long-term averages may not be the economic disaster it was made out to be last week.
Still, market focus remains squarely on the odds of a September rate cut. Rate markets have fully priced in the start of a rate cutting cycle when the Federal Open Market Committee (FOMC) meets on September 18, but bets of an initial double cut for 50 basis points have eased to slightly-better-than-even from nearly 70% earlier this week. According to the CME’s FedWatch Tool, rate traders are pricing in 53.5% odds of a 50 bps cut in September, with an additional two cuts worth 25 basis points apiece through the remainder of 2024.
Coming up next week, investors will get a fresh batch of inflation data to worry about, with US Producer Price Index (PPI) and Consumer Price Index (CPI) inflation on the cards for Tuesday and Wednesday, respectively. US Retail Sales and another update from the University of Michigan’s Consumer Sentiment Survey Index are also due later next week. Core PPI inflation and headline CPI inflation are both still stuck around 3% YoY, and investors will be hoping for a continued easing in the prints to keep the Fed on the rails toward rate cuts.
Dow Jones news
The Dow Jones remains on-balance on Friday, with the index split fairly equally between winners and losers. Intel Inc. (INTC) fell back another 4.4%, declining below $20.00 per share as the tech company continues to run out of ways to push its otherworldly P/E ratio back above 100.00. After roughly $4 billion in quarterly earnings missed estimates by $150 million, the company doubled down on keeping investors happy by immediately announcing layoffs of 15,000 people.
Dow Jones technical forecast
Friday’s flat-footed candlestick puts the Dow Jones entirely below the 50-day Exponential Moving Average (EMA) for an entire trading week, a feat the index hasn’t accomplished since mid-April’s swing low. The index still remains sharply down from record highs set at 41,371.38 in July, having fallen -7.22% peak-to-trough.
Despite a soft patch, the index is still holding ground in bull country above the 200-day EMA at 38,025.14, and buyers will take any excuse to reignite the furnace and gets bids back into the high side.
Dow Jones daily chart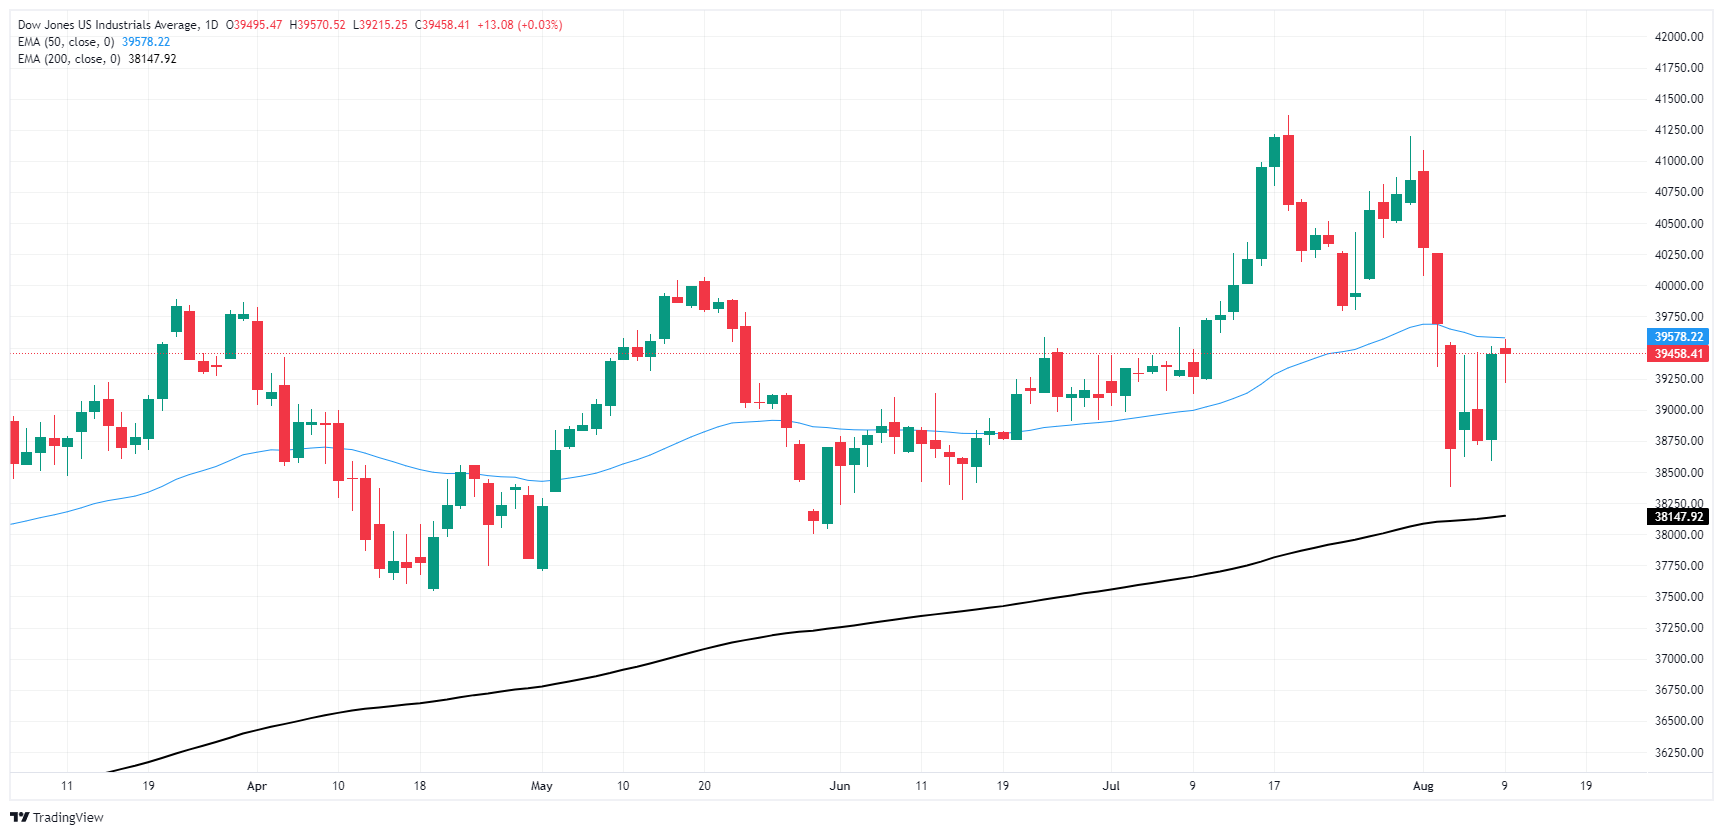
Economic Indicator
Producer Price Index (YoY)
The Producer Price Index released by the Bureau of Labor statistics, Department of Labor measures the average changes in prices in primary markets of the US by producers of commodities in all states of processing. Changes in the PPI are widely followed as an indicator of commodity inflation. Generally speaking, a high reading is seen as positive (or bullish) for the USD, whereas a low reading is seen as negative (or bearish).
Read more.Next release: Tue Aug 13, 2024 12:30
Frequency: Monthly
Consensus: -
Previous: 2.6%
Source: US Bureau of Labor Statistics
Related Articles
$660B Capex Bill Triggers $900B Wipeout: Why Apple Shares Outperform Amazon and Google Despite AI Lag
Based on financial disclosures, the combined 2026 capital expenditure forecasts for Meta, Amazon, Google, and Microsoft are projected to reach $660 billion. This figure is not only significantly higher than the $410 billion forecast for 2025 and $245 billion for 2024, but even surpasses the GDP of I
Amazon Stock Predictions for 2026 to 2030: Will They Exceed Expectations and Achieve Major Long-Term Goals?
TradingKey - As we head into 2026, many investors are questioning where Amazon (AMZN) fits into the technology world.
A Crash After a Surge: Why Silver Lost 40% in a Week?
TradingKey - Spot silver (XAGUSD) prices continue to decline. Silver plunged 20% on Thursday, breaking below $71 per ounce, with the sell-off intensifying on Friday as prices fell further below $64. Compared to the all-time high set on January 29, silver prices have retraced more than 40%, wiping out nearly all gains accumulated over the previous month.
Is Bitcoin’s Four-Year Cycle Dead in 2026?
Is the Bitcoin 4-year cycle dead? After 2025 broke historical records with a red post-halving year, institutional analysts explore if the Bitcoin price has decoupled from the halving countdown. Analyze the impact of spot ETFs, global liquidity, and the roadmap to the 2028 halving in this 2026 market

