[IN-DEPTH ANALYSIS] Coca-Cola (KO): The Twilight and Dawn of the Ice-Sugar Empire

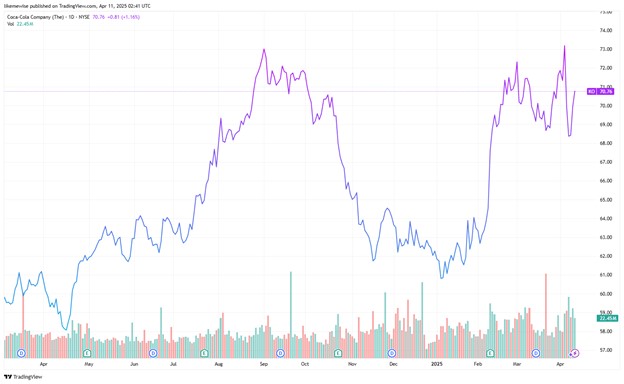
Source: TradingView
Key Points
- Coca-Cola's full-category health strategy drives growth. Sugar-free/low-sugar products offset the decline of traditional sugary categories, and non-carbonated beverages have become the second growth curve.
- The asset-light model consolidates the profit moat. By focusing on the production of concentrated solutions and brand operation, the company's profitability and operational efficiency continue to improve.
- The forward PE valuation is expected slightly decline to 26 times. With the increase in the dividend yield and share repurchase yield, there is a likelihood of a 10% increase in 2025 under the low-interest-rate environment.
Overview
Coca-Cola (KO) was founded in 1886 and headquartered in Atlanta, Georgia, USA. As a leading global beverage company, it operates in over 200 countries, offering a portfolio of 500+ brands across sparkling soft drinks, juices, water, sports drinks, and ready-to-drink coffee/tea. Coca-Cola holds 46% of the global carbonated soft drink market (as of Q1 2025) and serves 1.9 billion consumers daily. Its iconic flagship product, Coca-Cola Classic, remains the world’s most recognized brand, powering 70% of fast-food beverage partnerships (e.g., McDonald’s, KFC) and 90% of cinema chain collaborations globally.
Unlike traditional beverage competitors, Coca-Cola employs a “concentrate + ecosystem” model, leveraging its syrup production and franchised bottling network to scale efficiently while maintaining localized market adaptability. Compared to PepsiCo’s diversified snack-and-beverage strategy, Coca-Cola focuses on beverage vertical integration and brand loyalty cultivation—dominating 80% of vending machine placements and pioneering personalized packaging campaigns (e.g., “Share a Coke”).
Revenue Sources
1) Sparkling Beverages
Carbonated beverages of the Coca-Cola Company accounted for 62% of its revenue in 2024, which was driven by emerging markets such as India and Africa. However, the year-on-year growth rate of carbonated beverages fluctuated more significantly last year. Due to the implementation of sugar tax regulations and consumers' gradually shifting preferences towards low-sugar products, in the 2024Q4, the company's sales volume of carbonated beverages in North America decreased by 5.2%.
Specifically in products, traditional Coca-Cola, Sprite, Fanta, etc. still dominate, but their growth rates have slowed down due to the influence of the health trend; among sugar-free carbonated beverages, Coca-Cola Zero and Diet Coke have achieved double-digit growth rates, partially offsetting the decline in sugary products.
2) Non-Carbonated Beverages
The growth rate of this category has consistently been higher than that of carbonated beverages, and its growth momentum comes from consumers' trend of focusing on health. Functional beverages (such as Monster), ready-to-drink teas (Ayataka), coffee (Costa RTD), and plant-based beverages (Fairlife dairy products) contribute the main increments. The growth rates of sugary products such as juices and teas have slowed down, while healthy categories such as sugar-free sparkling water and low-sugar vitamin water are growing faster.
Period | 31-Dec-24 | 30-Sep-24 | 30-Jun-24 | 31-Mar-24 | 31-Dec-23 | 30-Sep-23 |
Sparkling Drinks | $12.3B | $12.8B | $13.1B | $13.4B | $13.6B | $13.2B |
YoY% | -5.2% | -3.1% | +4.8% | +7.5% | +8.9% | +6.3% |
Non-Carbonated | $7.9B | $7.6B | $7.2B | $6.8B | $6.5B | $6.1B |
YoY% | +9.7% | +8.4% | +7.1% | +5.6% | +4.3% | +3.8% |
Source: TradingKey, SEC Filings
The Coca-Cola Company has significantly differentiated sales strategies in its core regions. The North American market has the largest revenue scale, but its growth rate fluctuates significantly, which is mainly affected by sugar tax policies and the trend towards health consciousness, putting pressure on the demand for carbonated beverages. Therefore, it relies on the expansion of low-sugar products (such as Coca-Cola Zero) and coffee (Costa). Latin America is the region with the fastest growth rate, mainly benefiting from localized products (such as guarana beverages in Brazil) and the consumption upgrading trend there. The growth rate in the Asia-Pacific region is relatively gentle, mainly due to the intensified competition in the Chinese market (such as the rise of Genki Forest) and the challenges of market penetration in India.
Period | Dec-24 | Sep-24 | Jun-24 | Mar-24 | 31-Dec-23 | 30-Sep-23 | 30-Jun-23 |
North America | 4.68B | 4.98B | 4.81B | 4.17B | 4.04B | 4.46B | 4.37B |
North America Growth | 15.82% | 11.67% | 10.19% | 6.92% | 4.85% | 6.24% | 8.36% |
Europe, Middle East, and Africa | 1.79B | 2.02B | 2.34B | 1.97B | 1.69B | 2.18B | 2.19B |
Europe, Middle East, and Africa Growth | 5.98% | -7.22% | 6.90% | -2.52% | 11.26% | 13.63% | 0.18% |
Latin America | 1.64B | 1.64B | 1.65B | 1.53B | 1.49B | 1.57B | 1.38B |
Latin America Growth | 10.12% | 4.13% | 19.74% | 10.17% | 15.75% | 24.23% | 20.88% |
Asia Pacific | 1.22B | 1.35B | 1.51B | 1.47B | 1.12B | 1.40B | 1.57B |
Asia Pacific Growth | 9.06% | -3.78% | -3.51% | 7.15% | 7.11% | -1.75% | 0.06% |
Source: TradingKey, SEC Filings
In terms of the sales mode, the sales volume of non-ready-to-drink (NRTD) products has accounted for more than 80% of the total sales volume of Coca-Cola over the years, among which supermarkets and convenience stores account for nearly 70%. In recent years, due to factors such as the pandemic, the sales proportion of e-commerce channels has increased slightly, but it has not changed the absolute dominant position of offline channels such as offline retail store channels.
The Coca-Cola Company only produces and supplies concentrated liquid, and bottlers around the world are responsible for filling and distribution. For example, in the Asia-Pacific region, Swire and COFCO play a leading role, and in the Latin American market, it is covered by 36 bottlers such as Coca-Cola FEMSA.
Full Product Category Strategy
Since 2017, Coca-Cola has clearly defined its full-category research and development strategy, covering 5 major core categories. In addition to continuing the development of traditional carbonated beverages, it has strengthened its exploration of non-carbonated beverage categories. With the company's brand innovation and streamlining, its product matrix has been gradually improved. Among them, carbonated beverages account for a total of 69%, taking the dominant position, and sugar-free cola and coffee have the fastest growth rates.
In the area of juice and plant-based beverages (15% of revenue), Minute Maid holds the first place in the global market share. By acquiring Costa and expanding its oat milk coffee products (4% of revenue), it has achieved rapid growth.
In terms of alcoholic beverages (3% of revenue), Topo Chico was launched in 2020, marking Coca-Cola's first entry into the alcoholic beverage market. In 2023, the alcoholic beverage subsidiary Red Tree Beverages was established, moving into the category of non-traditional alcoholic beverages. Coca - Cola also joined hands with Jack Daniel's to release the pre-mixed Jack & Coca-Cola cocktail, making it the top-selling product in the ready-to-drink (RTD) whiskey category in the North American market.
Regarding the trend of sugar-free products, Coca-Cola Zero Sugar has achieved double-digit growth over the past five years. In 2024, BodyArmor, the main brand of the company's sports drinks, will launch sugar-free products, and the prospects of the sugar-free market are promising.

Source: Coca-Cola’s official website
In terms of market competitors and share, Coca-Cola dominates with a 13.0% market share and is the core product of the company. It faces intense competition from Pepsi - Cola in the cola category. The Coca - Cola Company and PepsiCo have formed an oligopolistic competition pattern in the carbonated beverage market, and the brands under the two companies. However Pepper has a loyal customer base in the southern North American market, and its share is close to that of Sprite. Diet Coke leads Diet Pepsi, but Mountain Dew has established a differentiated advantage in the teenage market. Overall, classic Coca - Cola and Sprite form the moats, yet the share of healthy products is insufficient. PepsiCo can leverage its snack channels for bundling to further squeeze long - tail market.
Table : Market Shares of Main Carbonated Beverage Producers

Source: Euromonitor, HTI
Sugar-Free Category Contributes to the Growth Rate
The global market for sugary carbonated beverages has entered a mature stage. In 2024, the market share of global sugary beverages continued to shrink. The compound annual growth rate of global sugary beverages in the past years was 3.2%. Some categories, such as traditional fruit juices, even experienced negative growth. Sugar-free beverages performed significantly better than sugary categories. According to the forecast of Market Research, the compound annual growth rate of sugar-free beverages will exceed 7% by 2030. Traditional beverage giants such as Coca-Cola and PepsiCo are also accelerating their transformation towards sugar-free products.

Source: Market Research Future
In recent years, sugar-free products have also served as a growth engine for Coca-Cola, but they still face the challenge of product differentiation. Specifically, the global sales volume of Coca-Cola Zero Sugar grew by 9% in 2024, making it the fastest-growing product under the Coca-Cola brand. In terms of technological innovation, the Coca-Cola Company has been developing natural sweeteners and functional health ingredients (such as collagen and GABA). For example, Coca-Cola plans to launch the "Coca-Cola Wellness" series in 2025, which will contain prebiotics.
Coca-Cola has maintained its leading position in the sugar-free beverage market, accounting for 30% of the market share. However, its future growth needs to address the challenge of emerging products and scenarios. Coca-Cola invests 30% of its R&D expenses in optimizing the sweetener combination and by enhancing the stimulating sensation of carbon dioxide, it aims to mimic the taste of classic cola and increase the repurchase rate of zero-sugar cola. Coca-Cola's patent portfolio of sweeteners (with more than 12,000 patents) forms a barrier against imitation. Nevertheless, it also needs to deal with the acceleration of healthy consumption trends and the potential impact of GLP-1 on carbonated beverages.
Localized Business Strategy: Address Tariff Challenges
Coca-Cola's globally localized supply chain has demonstrated strong adaptability in the face of the tariffs imposed by the United States. With localized production bases and bottling plants established in more than 200 countries, its "decentralized supply chain" enables it to flexibly respond to changes in regional policies. Localized production can also reduce the dependence on cross-border transportation and mitigate the impact of tariffs on a single market.
In recent years, the North American and Latin American markets have served as the main engines of growth, while the growth rate in the Asia-Pacific region has slowed down. The North American region benefits from the high penetration rate of soft drinks and the accelerated innovation of product categories. The Latin American region, by taking advantage of the locational advantages such as raw material and labor costs, has maintained an operating profit margin as high as 60%. In the Asia-Pacific region, although facing cost and competition pressures, the company can still maintain a stable growth rate through penetration into lower-tier markets and technological innovation of zero-sugar products.

Source: TradingKey, SEC Filings
The Coca-Cola Company has built a moat far exceeding that of PepsiCo by controlling the core value links and optimizing costs driven by digitalization. It has achieved the expansion of its franchise operations through the globalization of its bottling channels. The proportion of the Coca-Cola Bottling Investments Group's revenue decreased to 16%, and the company has improved its ROE by focusing on the production of high-margin concentrated syrup and brand operation. This asset-light model has enabled it to achieve a gross profit margin as high as 60%. In contrast, PepsiCo is more reliant on the North American market (accounting for 64% of its revenue), and the growth rate of its international business is relatively slow. Its efforts to expand the food production line and innovate in snack food categories have relatively reduced its capital utilization efficiency.
Financials and Valuation
The latest earnings report shows that Coca-Cola achieved revenue and EPS growth exceeding expectations, demonstrating that the company can counteract rising costs with its flexible globalization strategy. Moreover, the operating profit margin has continuously increased to above 23.5%, indicating that the company's health transformation strategy is gradually taking effect.
The management's guidance for 2025 is in line with expectations, with revenue expected to grow by year-on-year. The healthy product line is expected to boost profit margins, and the increased penetration in emerging markets such as Latin America and India is expected to drive up sales. In 2025 Coca-Cola is increasing its investment in health-oriented innovation and digitalization to improve efficiency, and the management has set a stable revenue target range.
Affected by the tariffs imposed by the US, Coca-Cola is facing cost issues such as the renewed increase in the prices of aluminum and PET, as well as the sustained high sugar prices. These factors have led to a year-on-year decline of 2 pct in the company's gross profit margin. However, considering that the period from 2024 to 2028 is the strategic transformation period of The Coca-Cola Company, the compound growth rate of emerging markets and zero-sugar products is expected to be over 7%. The localization strategy, product upgrades, and AI digitization will continuously increase the gross profit by 2 percentage points. As a result, the negative impact of tariffs can be effectively offset.
From a valuation perspective, the forward PE valuation of KO is expected to be around 26 times, which is very close to the historical average. Considering the increased dividend yield and share repurchase yield, the brand loyalty and the stability of its cash flow is expected to gain a valuation increase of around 10% in an environment of declining interest rates. That corresponds to a potential upside of over 10% in 2025, with a target price range of $77 to $83.
2024-12-31 | KO | PEP | MNST | KDP | CCEP | FMX |
Company Name | The Coca-Cola Company | PepsiCo, Inc. | Monster Beverage Corporation | Keurig Dr Pepper Inc. | Coca-Cola Europacific | Fomento Económico |
Return on Equity | 39.55% | 52.30% | 21.27% | 5.77% | 17.03% | 10.93% |
Return on Assets | 11.25% | 11.77% | 18.02% | 5.17% | 6.08% | 6.46% |
Gross Profit Margin | 61.06% | 54.89% | 54.04% | 55.56% | 35.63% | 41.12% |
EBIT Margin | 30.39% | 15.66% | 27.46% | 22.12% | 12.62% | 8.27% |
EBITDA Margin | 32.67% | 18.88% | 28.53% | 26.90% | 15.72% | 13.30% |
Net Income Margin | 22.59% | 10.43% | 20.14% | 9.39% | 6.94% | 3.61% |
P/E (TTM) | 24.87 | 18.38 | 36.35 | 17.82 | 27.1 | 19.27 |
EV/EBITDA (TTM) | 22.23 | 14.09 | 26.12 | 15.56 | 15.38 | 8.14 |
Average | 2.94% | 2.79% | - | 2.27% | 3.20% | 2.36% |
Source: Refinitiv