[IN-DEPTH ANALYSIS] Shopify: A Unique Competitor Leading the E-commerce SaaS Market


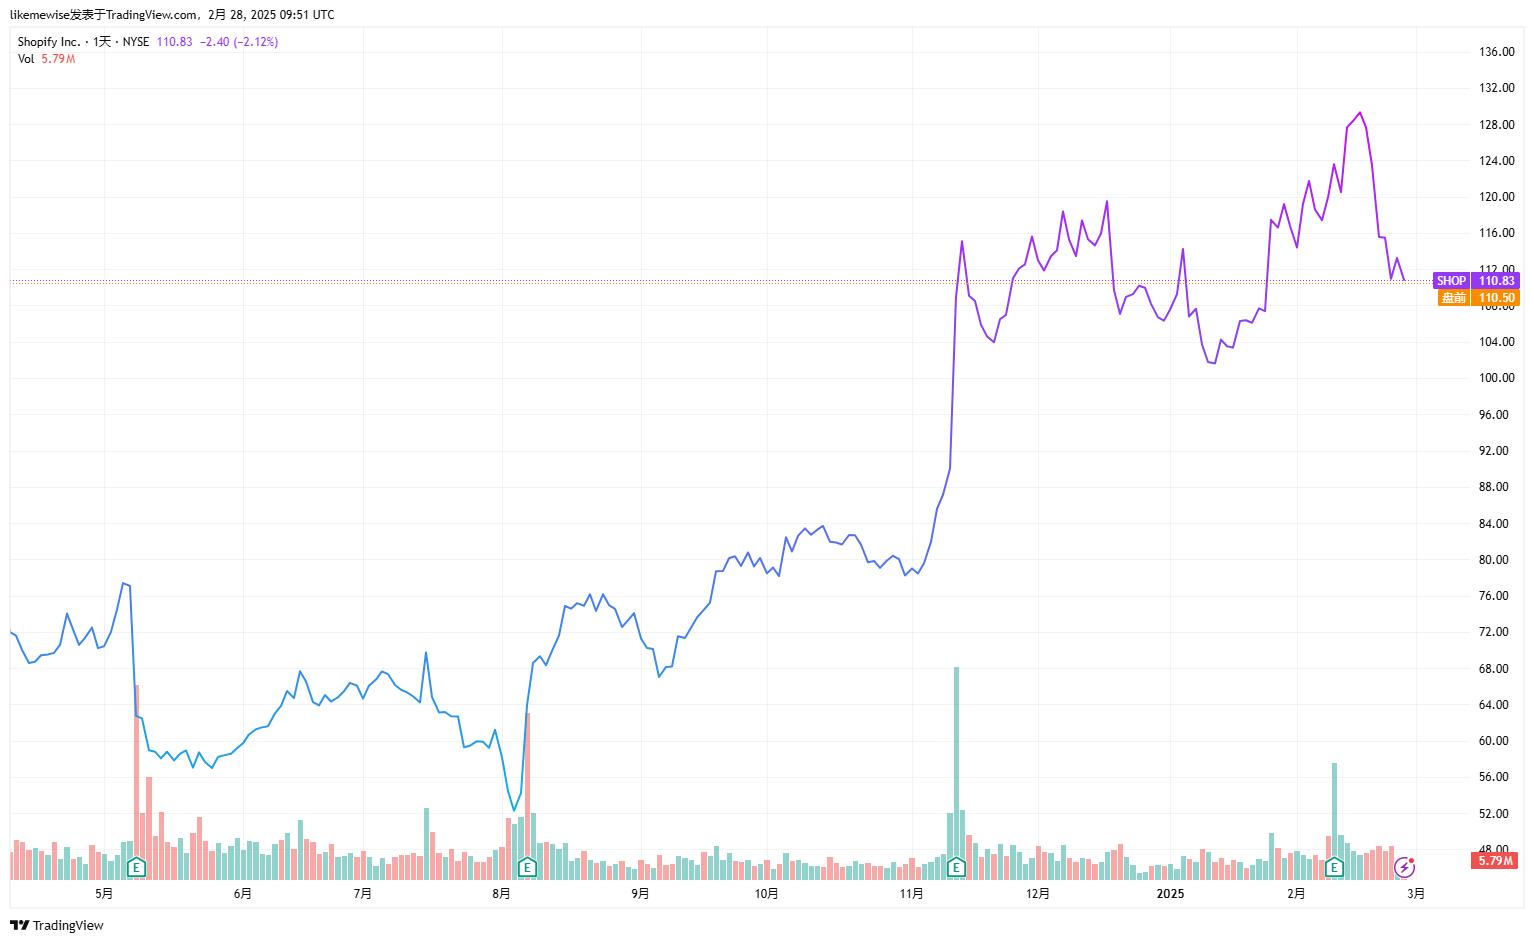
Source: TradingView
Key Points
- With the continuous increase in e-commerce penetration, especially in North America, Shopify's GMV will grow rapidly and continuously .
- Shopify has successfully expanded into the B2B sector, offering various customized solutions.
- Shopify Payment's GPV share continues to rise to 60% in 2024. Expansion into cross-border payments will further boost profitability.
- We estimate Shopify's fair value trading range to be between $100 and $140, approximately 20% upside potential in an optimistic scenario.
Overview
Shopify (SHOP.N), founded in 2004 and listed in 2015, is a globally renowned one-stop SaaS-based e-commerce service platform. Starting with providing lightweight website-building tools for small and medium-sized businesses, it has gradually developed into a leading player in the segmented, covering the entire e-commerce process, including payment, transactions, and logistics. Its business has expanded from the online sector to offline and the B2B field. Its core subscription solutions cover both website design and support systems, offering cloud solutions etc.
In the highly competitive e-commerce industry, Shopify serves more than 4 million merchants across 175 countries, holding a 8.3% share of the global e-commerce platform market in 2024, ranking second only to Amazon. Among these merchants, 54% are in North America, 27% in Europe and the Middle East, 14% in the Asia-Pacific region. Its revenue has grown from $205 million in 2015 to $8.8 billion in 2024, with an average annual growth rate of over 35%. The GMV in the North American region has achieved a compound annual growth rate of 39% over the past five years, far exceeding the overall growth rate of the e-commerce industry in the United States, demonstrating a strong development momentum.
Business Model
1) Revenue Streams: Shopify's revenue is divided into subscription solutions and merchant solutions. Currently, merchant solutions contribute the major revenue, while subscription solutions have higher gross margins. Merchant solution segments contribute slightly more to gross profit. The revenue primarily stems from payment processing fees, transaction fees, and other services, with payment processing fees being the largest component.
Period Ending | 31-Dec-24 | 30-Sep-24 | 30-Jun-24 | 31-Mar-24 | 31-Dec-23 | 30-Sep-23 | 30-Jun-23 | 31-Mar-23 |
Merchant Solutions | 6.55B | 6.02B | 5.70B | 5.45B | 5.22B | 4.94B | 4.70B | 4.38B |
Merchant Solutions Growth | 25.37% | 21.91% | 21.19% | 24.37% | 27.01% | 29.76% | 30.44% | 26.56% |
Subscription Solutions | 2.35B | 2.21B | 2.09B | 1.97B | 1.84B | 1.71B | 1.60B | 1.52B |
Subscription Solutions Growth | 27.93% | 29.03% | 30.13% | 28.94% | 23.50% | 19.00% | 14.56% | 11.59% |
Source: TradingKey, SEC Filings
2) Advantages and Barriers: As a company with payment as its core, Shopify’s competitive advantage lies in the independent e-commerce site system, which provides an independently controllable and exclusive payment scenario. However, the competitive challenges it faces include the comparison between the independent e-commerce sites and traditional e-commerce platforms, as well as the issue of its own unique advantages when its products overlap with those of other payment service providers.
Competitions Analysis
1) Platform vs. DTC Model
In the e-commerce industry, the platform - based model and the decentralized model show distinct characteristics. The platform model, represented by Amazon, has obvious centralized features. These platforms aim to build huge business empires. During operation, although they charge merchants fees, they prioritize maximizing consumer benefits. Its development positioning is to create a comprehensive e-commerce ecosystem, attracting numerous consumers and merchants to settle in. The advantage of this model is that it can gather massive traffic and offer consumers a rich selection of shopping options. However, its strong control over merchants is likely to limit their independent development space and against their long-term interests.
The DTC model means brand company can directly offer products or services to end-consumers via their own channels, cutting out intermediate and retailers in the traditional supply chain. This model has benefits such as lowering sales costs and enabling enterprises to better master consumer data, fueling the growth of the e-commerce SaaS service companies, which is represented by software platforms such as Shopify. Its core feature is to grant merchants a high degree of autonomy. Merchants can independently manage customer resources and freely choose promotion channels, logistics partners, payment methods, and so on.
With the development of the Internet and technology, fast - payment and high - efficiency logistics have been widely popularized. Shopify's development positioning focuses on providing professional technical support and services to merchants, helping them build their own brands and independent stores. The advantage of this model is that it fully protects merchants' autonomy, which is in line with the long-term development needs of merchants. However, a key drawback is that the platform itself has limited traffic, and merchants need to rely on external channels to attract traffic and expand their businesses.
Comparison | Shopify | Amazon |
Platform Type | Website building and hosting platform | Third-party online marketplace |
Pricing | $39 - $399 per month | Individual plan: $0.99 per item; Professional plan: $39.99 per month |
Templates and Design | Equipped with online website building tools, with a variety of professional and free templates | No control over store design |
Marketing Options | Social media integration, SEO, gift cards, discount codes, Google Ads credits | Amazon paid advertising, competitive pricing |
Transaction Fees | No transaction fees when using Shopify Payments, different rates when using external payment gateways | Pay referral fees according to product categories |
Competition | Responsible for marketing and standing out among numerous online stores | Competing with other sellers within each product category |
Logistics and Support | Shopify Lite offers 24/7 online chat and email; other plans offer 24/7 online chat, email, and phone support | Contact the Amazon Seller Support Team through the Seller Central account |
Source: Shopify, Amazon
2) Shopify vs WooCommerce
In the e - commerce DTC field, there is intense competition between Shopify and WooCommerce. They both hold significant positions in the market. As of 2024, among the top 1 million websites globally, Shopify ranked first with a 23% market share, and WooCommerce followed closely(18.2%). Shopify attracts various merchants with its one-stop services and user-friendly interface, while WooCommerce meets the needs of specific technical requirements through its open-source nature and flexible customization.
Shopify offers comprehensive services like website building, marketing, payment, and logistics. With a user-friendly interface and low technical barrier, over 80% of its users can start operating within a week without coding skills. It offers payment solution, Shopify Payments, has a GMV penetration rate of over 50% among its merchants. It provides tailored e-commerce solutions for businesses of all scales, making it an ideal choice for all kinds of enterprises.
By contrast, WooCommerce is an open-source e-commerce plugin integrated with WordPress. It caters to merchants with technical know-how seeking website customization. WordPress has extensive plugin ecosystem(over 50,000 plugins). WooCommerce allows merchants to use basic functions for free. Merchants only pay for premium plugins, enjoying high autonomy and flexibility. It's particularly suitable for WordPress users and those with a strong preference for website design flexibility.
Comparison | Shopify | WooCommerce |
Platform Introduction | A one-stop SaaS service platform that offers technologies and templates for building online stores, as well as services for omnichannel marketing, sales, payment, logistics, etc. | An open-source plugin built on WordPress, which helps users create and manage online stores on their own websites, with functions like product management, payment acceptance, and order tracking |
Platform Positioning | An easy-to-use platform that doesn't require handling technical details, suitable for start - ups, small and medium - sized enterprises, and large - scale enterprises | Suitable for merchants who have certain technical knowledge, such as programmers and designers |
Advantages | 1. Easy to use. It's a fully managed platform, eliminating the need for software installation, management, or updates. 2. High security. There's no need to worry about security, backup, and compatibility issues. 3. Has its own payment solution (Shopify Payments) and numerous third - party payment gateways. 4. The Plus plan offers enterprise - level services, with a powerful API and App Store for easy feature expansion | 1. Free open - source software. 2. Merchants have autonomous control, can add functions, and have strong flexibility. 3. Can create multiple online stores and websites. 4. Benefits from the powerful functions of WordPress websites. 5. Can be seamlessly integrated with dozens of payment services and gateways |
User Portrait | 1. Start - ups: Merchants making their first attempt at online sales. 2. Small and medium-sized enterprises: Those in need of comprehensive solutions 3. Online and offline retailers: Merchants requiring multi-channel sales. 4. Merchants who don't need to handle technical details | 1. WordPress users: Website owners who have already used the WordPress platform and need to add functions. 2. Merchants with a technical foundation and a high demand for design flexibility |
Pricing Model | 1. Basic: $29 per month 2. Shopify: $79 per month 3. Advanced: $299 per month 4. Shopify Plus: $2300+ per year (3 - year term) | 1. Basic functions are free, and premium plugins for value - added services are charged, with a starting price of $29 - $99. 2. Need to select a hosting partner and purchase a domain name. The domain name fee is $14.99, the SSL certificate fee is $69.99 (one - time payment) |
Market Share | In July 2024, it accounted for 23% of the e -commerce SaaS platform market share; | In July 2024, its market share in the global SaaS platform market was among the top 3 |
As of June 2024, its market share in the US region reached 28%; | As of May 2024, its market share is over 18.3%, ranked second only to Shopify |
Source: Shopify, WooCommerce
Outlook in 2025: Dual Drivers of B2B and Payment Businesses
For 2024-2025, Shopify's profitability and growth prospects remain optimistic. With the continuous growth in global online retail, particularly in the robust North American market, Shopify's GMV is expected to expand further. Its B2B business, as a second growth curve, will become a significant revenue driver through customized solutions and operational efficiency. Shopify Payment, as a crucial profit contributor, will further boost profitability with its growing GPV share and expansion into cross-border payments. Overall, The company is expected to see continued revenue growth and enhanced operational efficiency, solidifying its position in the e-commerce market.
1) The Increase in Penetration Rate Drives the Growth of Shopify's GMV.
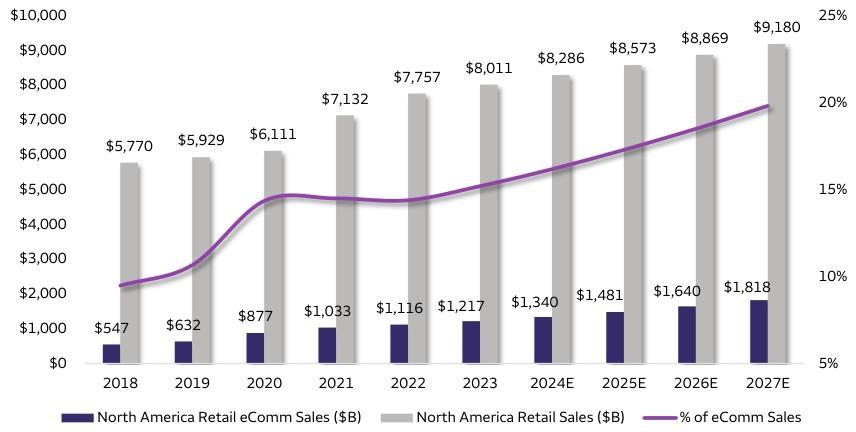
E-commerce penetration in North America, especially in the United States, continues to increase”. The United States has a high Internet penetration rate, with over 90% of the population having convenient access to the Internet, and smartphones are widely used. Consumers' shopping habits are gradually shifting online in recent years. In 2024, the retail e-commerce penetration rate in the United States reached 16.2%, an increase of 1.2 percentage up compared to 2022, accounting for over 80% of the North American region.
The eMarketer expected that by 2025, the retail e-commerce penetration rate in the United States is likely to climb to 17.5%, and the overall penetration rate in North America may reach 16.5%. As consumers' acceptance of online shopping increases and platforms and merchants continuously optimize their services, we believe the scale of the online retail market will continue to expand.
Source: Refinitiv, eMarketer
According to eMarketer, the total retail sales in the United States amounted to approximately $8.2 trillion in 2024,for one percentage point increase in the penetration rate, it is equivalent to an increase of approximately $82 billion in the size of the online retail market. Considering return rate of 16% and take rate of 2.3%, It is estimated that the global e-commerce SaaS market size will reach $51 billion in 2025 and $62 billion in 2026, reflecting a compound annual growth rate (CAGR) of approximately 26% over the two-year period. This projection highlights the high growth potential of the e-commerce SaaS industry, which is driven by value-added services and subscription services.
2) Shopify's B2B Business: Pioneering the Second Growth Curve.
In the enterprise B2B sector, Shopify's strategy is built on its strong DTC (Direct-to-Consumer) e-commerce foundation. By integrating platform resources, Shopify replicates and extends its successful model to business-to-business transactions. Leveraging its mature technical architecture and rich application ecosystem, Shopify provides customized B2B e-commerce solutions, offering a one-stop wholesale service that meets basic online business management needs while delivering highly personalized features to enhance operational efficiency and market competitiveness. According to Marketer research, the global B2B e-commerce market is expected to continue growing, with the number of enterprises subscribing to Shopify Plus for B2B purposes projected to increase by 20% by 2025. As Shopify optimizes its features and ecosystem, the operational efficiency of its B2B business is expected to improve by over 30%, strengthening customer loyalty and positioning B2B as a key growth driver.
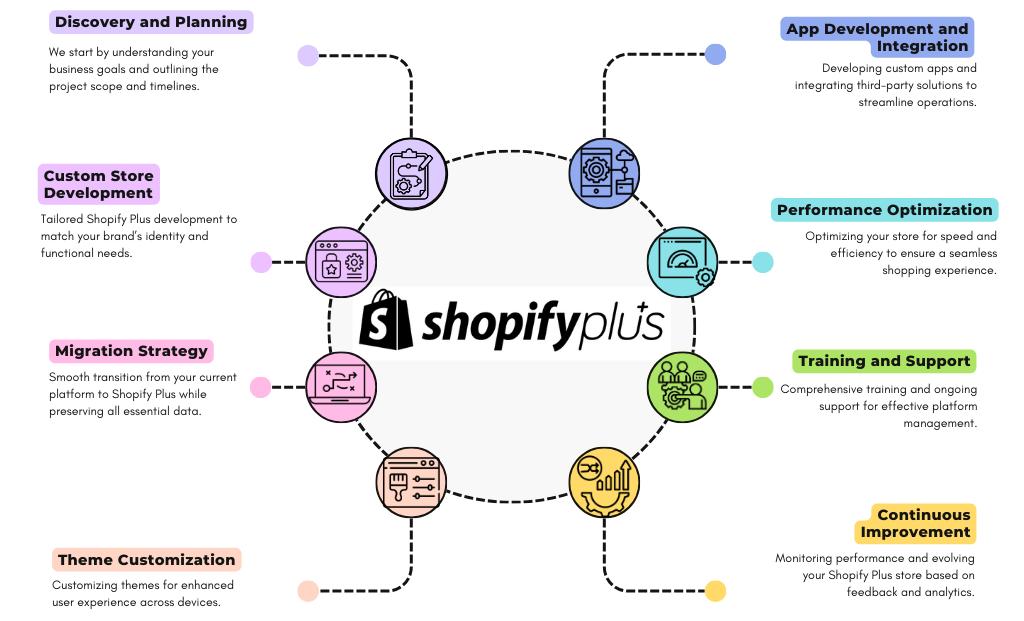
Source: ETG Digital,Shopify
B2B business is poised to become Shopify's second growth curve. Currently, enterprise clients account for about 4% of GMV, with significant room for rapid growth. Additionally, Shopify has a notable cost advantage, with a Total Cost of Ownership (TCO) approximately 31% lower than key competitors, thanks to its superior checkout conversion rates, lower implementation costs, and savings from Shopify Payments. We anticipate adding over 500 enterprise clients (with annual GMV exceeding $125 million) by 2027. Achieving this goal would enable Shopify to sustain overall revenue growth of over 20%, even if non-enterprise segments grow at a mid-to-high single-digit rate.
3) Payment GPV: The Primary Contributor to Merchant Service Revenue
Payment is a core position in Shopify's business system, and it is the main source of revenue for merchant solutions. It generates profits by charging transaction fees based on GMV. Shopify launched tiered charging model which directly drove profit growth. In 2024, the revenue of merchant solutions reached as high as $6.55 billion, with Payment contributing significantly. In terms of the take rate, it remains stable at around 2.3% overall, providing predictable and stable support for profitability. In 2023, the GPV of Shopify Payment reached nbsp;13.7 billion, accounting for 59% of total GMV, strongly promoting business growth.
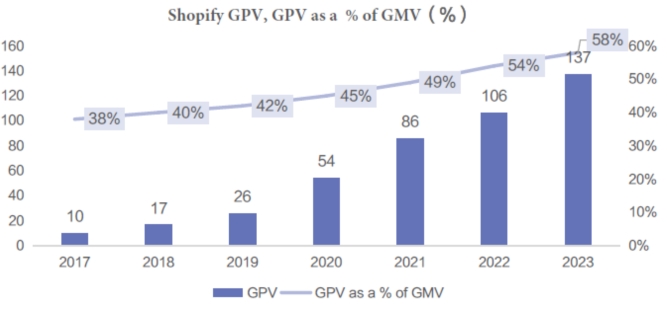
Source: Refinitiv, SEC Filings
Moreover, Shopify Payment is expected to make progress in the cross - border payment field. In 2024, Shopify's merchant adoption rate continued to grow. In the United States, the adoption rate increased from 88% in 2024 to 91%. In other countries, the adoption rate rose from 85% to 89%. These figures further solidify Shopify's leading position in the e-commerce SaaS field.
4) AIGC: A Catalyst for Shopify's Efficiency Boost
The application of AIGC on the Shopify platform significantly boosted sales growth. According to the data in 2024, Shopify's total revenue reached 8.88 billion US dollars, with a year-on-year growth of 25.78%. Among them, through personalized recommendation and automated marketing tools, AIGC technology has helped merchants improve customer engagement and conversion rates. eMarketer Data shows that for merchants using AIGC technology, the average customer transaction volume has increased by 15%.
AIGC has significantly improved the operational efficiency. For example, Shopify Magic has multiple auto-generation functions, such as product description generation and image background processing, which have greatly saved time for merchants. The AI assistant Sidekick helps merchants manage inventory accurately and reduces inventory costs by approximately 15% to 20%.
Financials and Valuation
Shopify reported an exceptional Q4 2024 earnings report. Q4 total revenue grew 31% YoY to $2.8 billion, while net profits surged 96.8%. Notably, B2B GMV grew over 140%. Shop Payment GMV for the full year grew over 50%, international GMV expanded 33%, and offline GMV increased 26%. These results highlight significant improvements and growth in its profitability metrics.
Looking ahead, Shopify's management expects Q1 2025 revenue growth to moderate but remains optimistic about long-term gross margin expansion. Key growth drivers include continued globalization, technological innovation with a focus on deepening AI applications, and business diversification to unlock the potential of offline and B2B segments.
Despite Shopify's rapid growth in SaaS and strong recent earnings, its newly gained credibility in the B2B area is expected to open a new phase of growth, providing long - term bullish outlook. As a result, we believe the company's current elevated valuation multiples are justified and do not indicate a bubble. Whether evaluated by enterprise value, PE or PS ratios, the current share price already reflects over 20% EPS growth for 2025. We estimate Shopify's fair value trading range to be between $100 and $140, implying approximately 20% upside potential in an optimistic market scenario.
Valuation | 31-12-2024 | 30-09-2024 | 30-06-2024 | 31-03-2024 | 31-12-2023 | 30-09-2023 | 30-06-2023 |
Enterprise Value($mn) | 132,828 | 99,541 | 81,014 | 95,071 | 95,813 | 65,981 | 78,983 |
Free Cash Flow Yield - %, TTM | 1.2% | 1.4% | 1.5% | 1.1% | 0.9% | 1.0% | 0.3% |
Price to Sales | 15.55 | 12.76 | 11.11 | 13.55 | 14.37 | 10.55 | 13.11 |
Price to Free Cash Flow per Share, TTM | 86.45 | 73.18 | 67.03 | 95.54 | 112.1 | 99.24 | 407.4 |
Price to Cash Flow per Share, TTM | 67.18 | 73.74 | 65.55 | —— | 502.2 | —— | —— |
Price to Diluted EPS | 68.54 | 74.83 | 66.34 | —— | 758.8 | —— |
|
PE Growth Ratio, TTM | 0.05 | 0.34 | 0.41 | —— | 7.31 | —— | —— |
EV to Sales | 14.96 | 12.12 | 10.43 | 12.82 | 13.57 | 9.92 | 12.53 |
EV to FOCF | 83.17 | 69.51 | 62.95 | 90.46 | 105.9 | 93.36 | 389.6 |
Source: Refinitiv