An Overview of US Labour Reports: A Guide to Nonfarm Payrolls(NFP) & Market Impact


TradingKey - When it comes to US economic data, the Nonfarm Payrolls (NFP) is indeed one of the most significant indicators. This employment report, covering more than 90% of the employed population in the U.S., often causes significant fluctuations in US stocks, foreign exchange, and gold on the so-called "NFP Day".
In addition, Wall Street frequently references job market indicators such as ADP and JOLTS. We will introduce the job market indicators and analyze why the NFP report is so important.
An Overview of US Employment Indicators
Promoting employment and stabilizing prices are the ultimate goals of the Federal Reserve's monetary policy. After the COVID-19 pandemic in 2020, the Fed's tightening policy transitioned into a new phase. During this shift, policymakers' focus expanded from primarily addressing inflation to balancing both inflation and the job market.
Referring to the "Labor Market Distributions Spider Chart" of the Federal Reserve Bank of Atlanta, some research has classified the metrics into five categories:
Labor Force Participation | Unemployment rate (CPS), Employment-population ratio, ages 25–54 (CPS), Work part-time for economic reasons (CPS), Marginally attached workers (CPS) |
Labor Force Flows | Job finding rate (CPS), Initial claims(UI), NFP Nonfarm Payrolls (CES), ADP Employment |
Employer Behavior | Payroll employment (CES), Private job openings rate (JOLTS), Private hires rate (JOLTS) |
Wages | Employment Cost Index growth (NCS), Average hourly earnings growth (CES) |
Labor Force Confidence | Hiring plans (NFIB), Firms unable to fill job openings (NFIB), Job availability (Conference Board), Private quits rate (JOLTS) |
[Source: Sealand Securities, TradingKey]
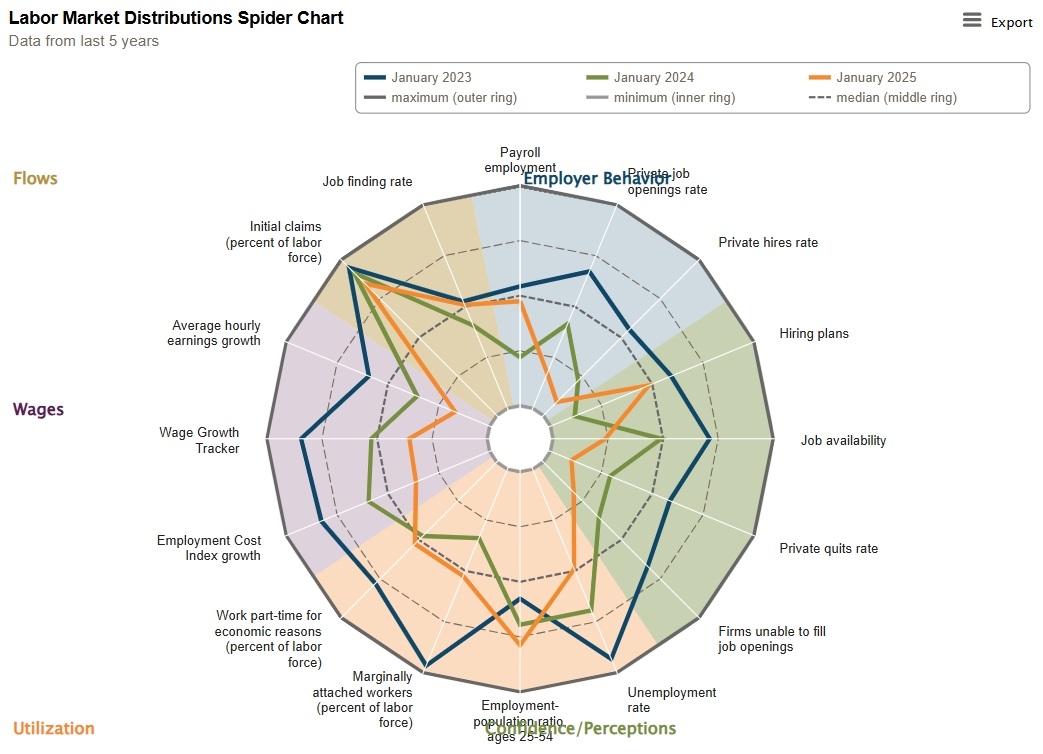
[Labor Market Spider Chart, Source: Atlanta Fed]
Among the numerous US labor market indicators, the Federal Reserve and the market primarily focus on the following: nonfarm payrolls, unemployment rate, average hourly wage, ADP, JOLTS, Challenger job cuts, initial claims, etc.
1. Nonfarm Payrolls Report; Importance: 5 Stars
The U.S. Nonfarm Payrolls (NFP) report is the employment dataset in the non-agricultural sector, released by the US Bureau of Labor Statistics on the first Friday of each month, and it is widely regarded as one of the most important employment reports.
The NFP report includes key labor market indicators such as changes in the nonfarm sector, the unemployment rate, average hourly wage, labor force participation rate, etc.
The report is compiled from two sources: Current Employment Statistics (CES) survey of enterprises and the Current Population Survey (CPS) of households. These two surveys differ in statistical scope and methodology, leading to occasional discrepancies in their results. The nonfarm payrolls reported each month come from the CES enterprise survey; the CPS conducts telephone or face-to-face interviews with households of residents aged 16 and above, primarily to count the unemployment rate.
Additionally, BLS releases the Quarterly Census of Employment and Wages (OCEW) every quarter, excluding the employment of illegal immigrants. The OCEW is based on employment insurance payment records and covers more than 95% of US jobs. The OECW is often used as a reference for compare and revise the CES and CPS estimates.
2. ADP Employment; Importance: 4 Stars
The ADP employment report is released by Automatic Data Processing, Inc. on the first Wednesday of each month. It only includes the private sector, while the Nonfarm Payrolls report covers both the private and government sectors.
Compared with the NFP, the ADP report has several advantages: released earlier; focus on the private sector, eliminating the interference of government employment flatucations. It classifies business by size, with small and medium-sized enterprises being more sensitive to the economic cycle. It helps balance the market expectations ahead of the NFP release.
ADP employment also exhibits seasonal patterns. Each year, temporary employment tends to rise in June, July, November, and December due to summer vacation, Thanksgiving and Christmas.
3. JOLTS Report; Importance: 3 Stars
The Job Openings and Labor Turnover Survey (JOLTS) is released by the US Bureau of Labor Statistics on the second Wednesday of each month. It tracks job vacancies that employers intend to fill within 30 days.
The job vacancy report includes main indicators such as the number of job openings, recruitment data, and the number of voluntary quits. An increase in job vacancies indicates that business are willing to expand their workforce.
The job vacancy report is often considered a leading indicator of economic trends and was one of the employment metrics highly valued by former U.S. Treasury Secretary Janet Yellen during her tenure as Chair of the Federal Reserve.
4. Challenger Job Cuts; Importance: 3 Stars
The Challenger job cuts report is a monthly statistic on workforce reductions by U.S. companies, released by Challenger, Gray & Christmas, Inc. on the first Wednesday of each month.
This data provides direct insight into companies' labor force planning. A significant increase injob cuts by enterprises often indicates that businesses are experiencing operational pressure or hold a pessimistic outlook on future economic conditions.
The Importance of Nonfarm Payrolls
The NFP report covers more than 90% of the employed population in the United States, and the total output of the nonfarm sector accounts for more than 80% of the total output of the US.
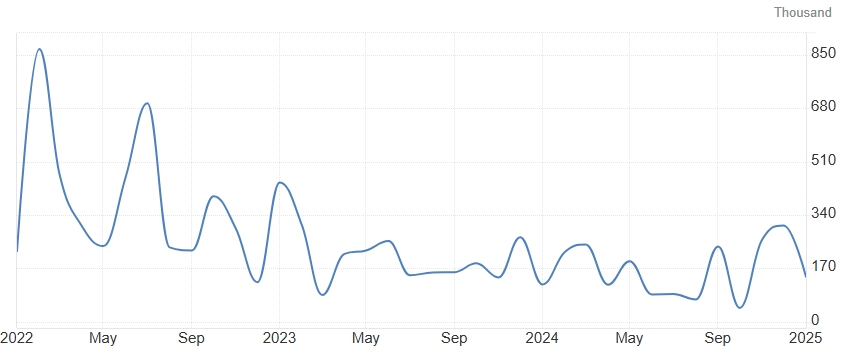
[Monthly US Nonfarm Payrolls, Source: Trading Economics]
There are three key indicators in the nonfarm payrolls report:
1. Nonfarm Payrolls
This aggregate indicator directly reflects the change in employment levels and is measured by the CES of the BLS. Nonfarm payrolls encompass employment in both the private and government sectors. The private sector includes jobs in the manufacturing and services, with the service industry being the largest employer in the U.S., followed by the government sector and the manufacturing industry.
2. Unemployment Rate
It is measured by the CPS, and is considered a lagging indicator of the economic cycle. There are six measures of the unemployment rate ranging from U1 to U6, with the definition of the unemployed becoming progressively broader. The official unemployment rate is U3.
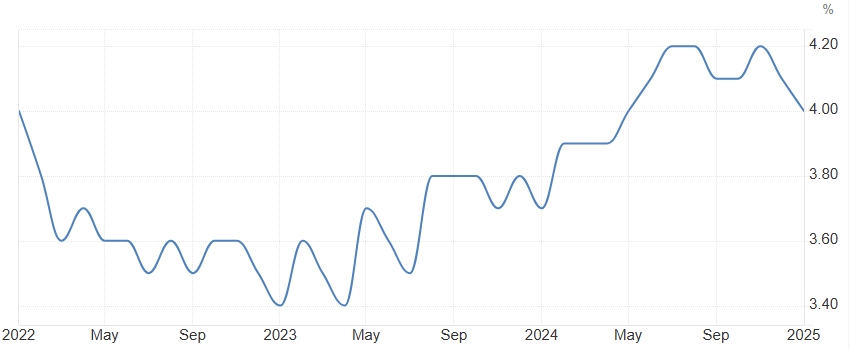
[US Unemployment Rate Data, Source: Trading Economics]
3. Average Hourly Wage
The change in the average hourly wage is reported by the CES. It not only reflects the tightness of the job market but also helps assess inflation trends in the U.S., serving as a key factor in the Federal Reserve's monetary policy decisions
The U.S. NFP report and "NFP Day" attract significant attention mainly for the following reasons:
Economic Health | Economic Growth | It reflects the vitality of enterprises in the United States as a whole and in various sectors. |
|---|---|---|
Consumption Level | Employment is the basis of income, and employment growth often drives consumer spending. | |
Basis for Monetary Policy | Fed's Decision-making | Strong NFP indicates a risk of overheating in the economy, and the Fed's policy tends to be tight. Weak NFP indicates a risk of a cooling economy, and the Federal Reserve's policy tends to be loose. |
Interest Rate Expectations | Strong NFP enhances the expectation of interest rate hikes. Weak NFP boosts the prospects of interest rate cuts. | |
Fluctuations in Financial Markets | Stocks, bonds, foreign exchange, etc. | If NFP is strong, US stocks rise, the US dollar appreciates, risk-averse funds sell US bonds, and the price of gold... |
Market Expectations | Market Confidence | Strong employment conveys a signal of good economic fundamentals, corporate investment ↑, consumption activities ↑, etc. |
[Source: TradingKey]
Analyzing the NFP report can be combined with the survey data to assess economic trends. Regarding the Federal Reserve's interest rate cuts, a decline in NFPs and a rise in the unemployment rate often signal an impendning rate cut.
Historically, the following patterns have been observed:
- Unemployment Rate: Consecutive monthly increases are not required for an interest rate cut, but an overall upward trend is typically evident beforehand.
- Nonfarm Payrolls: This indicator shows a more pronounced downward trend than the unemployment rate and exhibits cyclical declines leading up to an interest rate cut.
- Differentiated Industry Performance: The sequence of economic cooling usually shows as mid- and upstream manufacturing and wholesale → interest rate-sensitive services → essential services.
At the beginning of August 2024, U.S. nonfarm payrolls increased by 114,000 in July, significantly below the expected 179,000, and the unemployment rate rose on a monthly basis. Combined with the impact of the BOJ's unexpected interest rate hike at that time, the global market experienced a "Black Monday".
The Market Impact of Nonfarm Payrolls
The NFP report serves as a key indicator of economic conditions and plays a guiding role inmonetary policy. As a result, the stock market, foreign exchange market, and gold market often react accordingly:
1. US Stocks
Theoretically, strong employment growth indicates solid economic fundamentals, supporting businesses and driving consumer spending, which in turn provides positive feedback to enterprises. However, this is not always the case.
- In a Low Inflation Cycle: Strong NFP data signals a healthy economy, an optimistic business outlook, and an increase in the stock prices of listed companies, driving an increase in the main US stock indexes. Weak NFP data suggests NFPs indicate insufficient economic growth momentum, increasing the risk of investing in stocks rises.
- In a High Inflation Cycle: Strong NFP data signals an overheating economy, increasing expectations on Federal Reserve interest rate hikes. Higher interest rates put downward pressure on stock valuations, leading to a weaker stock market.
2. Foreign Exchange
The NFP report primarily impacts the foreign exchange market through the fluctuations in the U.S. dollar's value and international capital flows. Strong NFP data supports the appreciation of the US dollar index. Global investors are more inclined to allocate funds to U.S. assets. However, the U.S. the U.S. dollar is under pressure against major currencies. Conversely, weak NFP data leads to a weaker U.S. dollar, strengthening other currencies.
3. Gold
Gold is one of the most favored safe-haven assets for investors. Weak NFP data increases risk aversion, driving up gold prices; strong NFP data reduces safe-haven demand, leading to a decline in gold prices.
Since the gold is denominated in U.S. dollars, the results of nonfarm payrolls also influences the price of gold through dollars' movement. Strong employment data strengthens the U.S. dollar, increasing the cost of holding gold, which may lead to a drop in gold prices.
In addition to the "Black Monday" in August 2024 mentioned above, there have been several historical instances where nonfarm payrolls data triggered significant shocks in the capital market, acting as "butterfly effect" events.
- Nonfarm Payrolls Warning in 2008 and the Financial Crisis
- The Taper Tantrum in 2013
- Nonfarm Payrolls in June 2016 and the Black Swan of Brexit
- Nonfarm Payrolls in April 2020 and the Pandemic
- Nonfarm Payrolls in June 2022 and Interest Rate Hikes
The Revision of Nonfarm Payrolls
When the NFP report is released, we often see the revised values of nonfarm payrolls, consisting of monthly revisions and an annual benchmark revisions.
- Monthly Revisions: The preliminary revision and a final revision, primarily adjusting the number of newly added employees and sector-specific data. However, the unemployment rate remains unchanged.
- Annual Benchmark Revision: Released alongside the February NFP report, this revision updates the previous year’s data. It replaces the enterprise survey with tax records for greater accuracy and extends revisions to data from the past five years. data from the past five years.
The main reasons for the need to revise NFPs include: lag in survey responses; seasonal errors; changes in industry structure driven by emerging sectors; Discrepancies between the samples of the enterprise survey CES and the tax data QCEW, etc.
There have been several cases of significant revisions in history. For example, the NFPs of the previous year released in 2021 were revised upward by 680,000, the nonfarm payrolls of the previous year released in 2023 were revised downward by 306,000, and the final value was adjusted to a decrease of 20.8 million people in the early stage of the pandemic in 2020, etc.
A significant revision of NFP often can fundamentally alter the perception of the economy. Analyzing these revisions requires contextual judgment in combination with the economic environment at that time, such as the PMI index and other monthly economic indicators, and it is also necessary to be vigilant against the noise in the report.