3 Key US Economic Growth Indicators: Why The PMI & Retail Sales Matter


The United States is the world's largest economy, and the US dollar is arguably the most important international currency globally. US macroeconomic indicators have long been regarded as a barometer of global economic development, which global investors must pay attention to.
During Joe Biden’s administration term, apart from the COVID-19 lockdown impact, Biden implemented "Bidenomics" through multiple relief programs and an unlimited quantitative easing policy. This subsequently led the US to high inflation and high interest rates. This economic environment has also spread to major countries and regions such as Europe and Australia, prompting them to adjust their macro policies to adapt.
As the United States steps into Donald Trump’s second term, the measures he has advocated for such as tariffs, have already caused global stock and foreign exchange markets to react strongly.
In addition to the Gross Domestic Product (GDP), terms like Nonfarm Payrolls, "Terror data", and the PMI often appear in media headlines and influence the flow of funds in the capital market.
This article will focus on introducing indicators to pay attention to regarding overall economic growth, providing decision-making references for investors before and after the data releases.
An Overview of US Economic Growth Indicators
There is countless data for measuring US economic growth. From a broader perspective, overall indicators such as GDP and GNP, employment indicators such as nonfarm payrolls and the initial jobless claims for the week, and inflation indicators such as the CPI, PPI, and PCE can all show the current state of the US economy, whether it is booming or sluggish.
More specifically, data such as GDP for measuring overall growth, retail sales data for measuring US consumption, the PMI for measuring the prospects of the industry, and building permits for measuring the real estate industry are more intuitive.
Description | Release Date | |
Gross Domestic Product (GDP) | An overall indicator that measures the total value of final labor or goods produced by a country within a certain period | The preliminary value of the previous quarter is announced at the end of the first month after the end of each quarter, followed by the revised value and the second revised value announcement |
Retail Sales | Also known as the "terror data", it measures the demand for goods by enterprises and individual consumers; US consumption accounts for 70% of GDP | Mid-month of each month |
Purchasing Managers' Index (PMI) | An index that measures the economic activities of the manufacturing and non-manufacturing industries, including data such as new orders, output, employment, supplier delivery times, and inventory | Released by the Institute for Supply Management (ISM) on the first working day of each month; the release time of the S&P Global PMI index is similar |
Nonfarm Payrolls (NFP) | Measures the employment situation in the non-agricultural sector of the United States; nonfarm payrolls account for more than 90% of US employment | The first Friday of each month |
Durable Goods Orders | A leading indicator of the manufacturing industry's prosperity, measuring the quality of production in the coming month | The data of the previous month is announced in the middle of the month, and the revised value is announced at the beginning of the next month |
Building Permits & Housing Starts | Leading indicators of the real estate industry. The monthly new residential construction report includes three aspects: housing starts permits, building permits, and housing completions | The third Tuesday of each month |
[Source: Compiled by TradingKey]
Gross Domestic Product (GDP)
Gross Domestic Product (GDP) is a comprehensive indicator for measuring a country's economic activities in a quarter or a year. The statistics of US GDP are formed based on the National Income and Product Accounts system of the Bureau of Economic Analysis (BEA) of the United States.
In view of the timeliness and accuracy of the data, the BEA will make three estimates of the GDP: the preliminary estimate (the initial value) of the GDP of the previous quarter is announced at the end of the first month after the end of each quarter, the second estimated value is announced one month after the initial value, and the final estimated value is announced one month later. From July to August each year, the BEA conducts annual revisions of the GDP for the previous five years.
[US GDP Annualized Quarter-on-Quarter, Source: Trading Economics]
Historically, the market often reacts most strongly to the initial GDP value, which is the most timely but least accurate GDP data.
There are three methods for measuring GDP: the expenditure approach, the income approach, and the production approach. The United States uses the expenditure approach, and its GDP composition includes consumption, government spending, investment, and net exports. The US economy is dominated by consumption and investment, accounting for about 70% and 19% respectively.
- Consumption: When consumer confidence rises and consumer spending increases, economic growth is dynamic.
- Government Spending: When the government expands spending in areas such as infrastructure, it can drive the development of related industries.
- Investment: When businesses increase investment, they expand future production capacity.
- Net Exports: When the trade surplus expands, export enterprises benefit.
The change in US GDP can affect market performance in many ways. Take positive growth as an example:
-Economic Health and Corporate Profits: It is a barometer of economic health. During economic expansion, corporate revenues and profits increase; businesses increase investment and expand production capacity.
-Consumer Activities: Consumer confidence increases, and the retail and consumer goods industries grow.
-Monetary Policy and Interest Rates: The economy and inflation rise together, but be wary of the Federal Reserve raising interest rates to curb inflation, putting pressure on the stock market.
-Policy and Market Confidence: Fiscal expansion drives the stock market, while fiscal tightening suppresses vitality, causing fluctuations in market confidence.
-Industry Differentiation: During economic expansion, cyclical industries such as technology, finance, and energy show greater flexibility, while defensive sectors such as utilities and essential consumer goods are slightly inferior.
Some people have accused "Bidenomics" of being a failure as a result of the increased burden of high prices on people's lives. However, it is undeniable that during the four years of the Biden administration, the US economy maintained steady growth, and the unemployment rate remained at its lowest level in 50 years, which is also a major driving force for the S&P 500 index to continuously reach new highs.
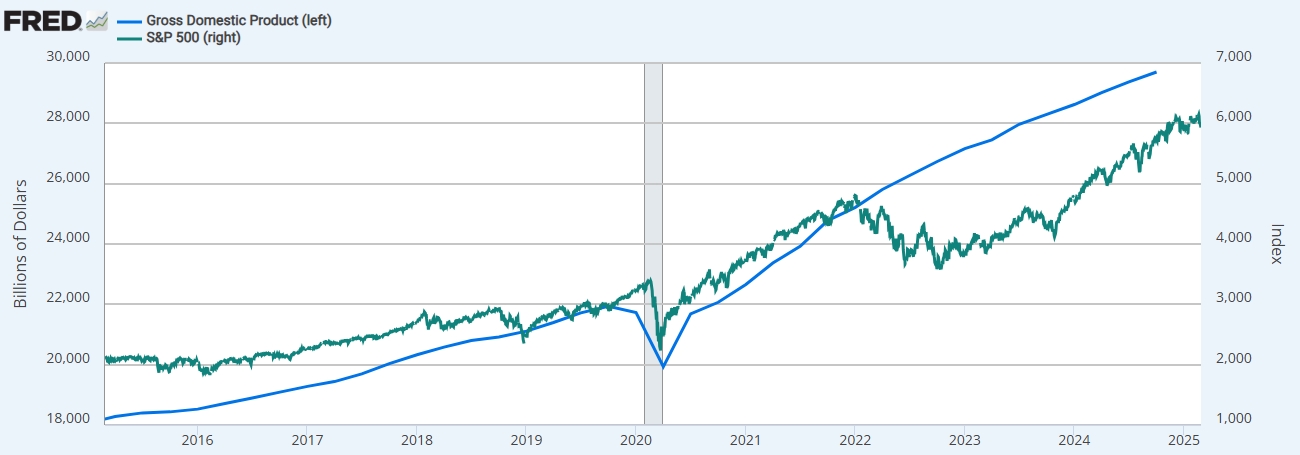
[The Trends of US GDP and the S&P 500 Index, Source: Stlouisfed]
The International Monetary Fund (IMF) forecasts that the global economic growth rate is expected to be 3.3% in 2025 and 2026. Among them, the US GDP growth rates are 2.7% and 2.1% respectively, slowing down compared to 2.8% in 2024.
The Organisation for Economic Co-operation and Development (OECD) predicts that the global economy will enter a "low-growth normal" in 2025, and the US economic growth rates in 2025 and 2026 will be 2.4% and 2.1% respectively.
Purchasing Managers' Index (PMI)
The PMI (Purchasing Managers’ Index) is an important leading indicator for measuring the activities of the manufacturing and service industries in the United States. The PMI index is a month-on-month dataset that measures whether economic activities expand or contract compared to the previous month.
There are two reasons why the PMI is considered a leading indicator of the macroeconomy: this index counts the production index, new order index, and the number of employees, reflecting all the preceding links and development trends of corporate production and operation; the PMI is timely and is released early, allowing us to understand the economic situation of the current month on the first working day of the next month.
The Institute for Supply Management (ISM) and Markit, which has been acquired by S&P Global, are the two main publishers of the PMI, releasing the ISM PMI index and the S&P PMI index respectively. Their release times are similar, and there are certain differences in sample selection and survey objects. Therefore, their overall trends are mild, but sometimes there will be divergences: ISM conducts surveys on the purchasing managers of more than 400 enterprises, which is more subjective; Markit conducts surveys on the actual business conditions of more than 800 enterprises in the United States.
The Institute for Supply Management (ISM) conducts surveys on purchasing managers every month, collecting data on new orders, production, employment, supplier deliveries, and inventory levels, but the weights are the same. Markit gives different weights to each item:
- New Orders: 30%
- Production: 25%
- Employment: 20%
- Supplier Deliveries: 15%
- Inventory levels: 10%
The PMI index ranges from 0 to 100, and 50% is the "dividing line". When the PMI index is equal to 50, it indicates that the economy is stable; when the PMI index is greater than 50, the economy is expanding; when the PMI index is less than 50, the economy is contracting.
The PMI index has an important impact on economic early warning and the financial market:
- Economic Early Warning: For example, if the new order index increases, the willingness of enterprises to increase spending and expand production capacity will increase, and enterprises and policymakers can make preparations in advance.
- Financial Market: If the PMI index is better than expected, it indicates that the business operations of enterprises are good and the profit prospects are optimistic, which will boost market confidence and cause the stock market to rise, etc.
Considering the increasing dominance of the service industry in the United States, the performance of the US manufacturing PMI index may not necessarily have an inevitable connection with the overall economic growth and the rise and fall of the stock market. Since 2022, affected by factors such as the Federal Reserve's interest rate hikes, supply chain disruptions, the outflow of the manufacturing industry, and the shrinkage of demand, the manufacturing PMI index has been below the boom-bust line of 50 for a long time, but the economy and the stock market have continued to grow.
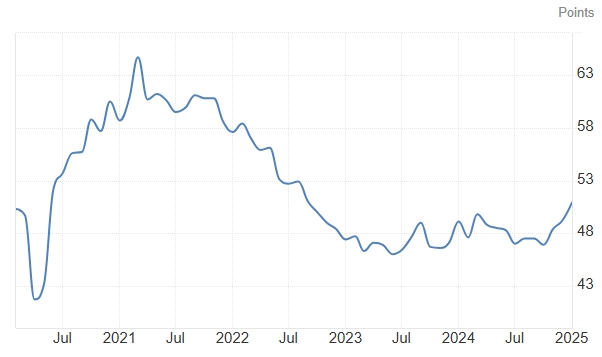
[US ISM Manufacturing Index, Source: Trading Economics]
Retail Sales
If GDP is a comprehensive index and the PMI is a supply index, then retail sales data is the most crucial consumption indicator. The United States has a consumption-driven economy, with 70% of GDP being consumer spending, and retail sales accounting for 40% of consumer spending. It’s believed that if retail sales are strong, the economy will not be bad.
Retail sales are the sales of retail goods and services compiled by the US Department of Commerce every month, and the figures for the previous month are announced in the middle of each month. It is called the "terror data" because it often brings fluctuations to the stock market and economic expectations:
-Sensitivity as an Economic Barometer: Its proportion in GDP and consumer spending.
-Timeliness of Data and Data Resonance: Strong retail sales often drive the wage-price spiral and affect data such as consumer confidence and trade.
-Significant Market Volatility: There are large fluctuations in stocks, bonds, and foreign exchange. Historical events: Retail sales shrank for 12 consecutive months in 2008, and the Dow Jones Industrial Average fell 20% in a single month; at the beginning of the COVID-19 pandemic in 2020, retail sales in March plummeted by 8.7%, and there was a wave of circuit breakers in the global market.
-Uncertainty of the Data Itself: The price fluctuations of goods such as gasoline sometimes distort the data trend.
-Market and Media Labeling: The self-fulfilling prophecy of the name "terror data".
Retail sales data will be affected by seasonality. The fourth quarter of each year is often a peak shopping season due to holidays such as Christmas and Thanksgiving.
Retail sales statistics cover data from 13 industries, namely motor vehicle & parts dealers (accounting for about 20%), non-store retailers (>10%), general merchandise stores (>10%), food services & drinking places (>10%), gasoline stations (10%), building material & garden eq. & supplies dealers, health & personal care stores, clothing & clothing accessories stores, miscellaneous store retailers, furniture & home furnishings, electronics and appliance stores, and sporting goods, hobby, musical instrument & book stores.
Retail sales data can be analyzed from multiple dimensions:
-Overall Trend: The absolute value reflects the retail scale; the month-on-month and year-on-year growth rates reflect changes in the economic fundamentals.
-Core Data: Core retail sales, which exclude the more volatile automobiles, gasoline, and building materials, can better reflect daily consumption demand.
-Difference from Expectations: Compare the actual value with the expected value statistically calculated by institutions or the media.
-Consumption Structure: The sales of essential goods (food, medicine) are relatively stable. If the growth slows down, it may mean that low-income groups are affected by inflation; the sales of non-essential goods (electronics, clothing) are more volatile. If they grow strongly, it means that consumer confidence is increasing.
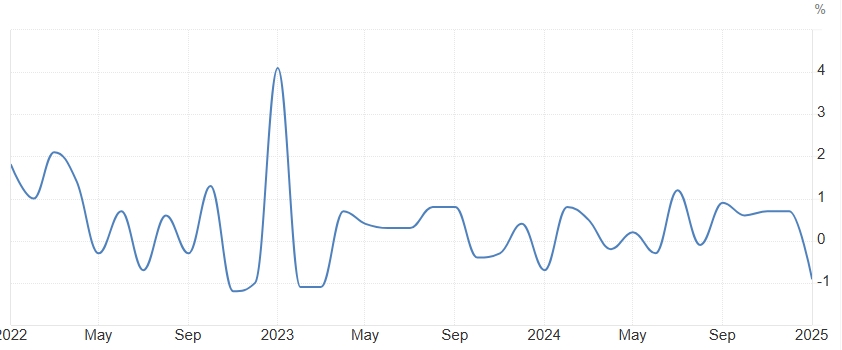
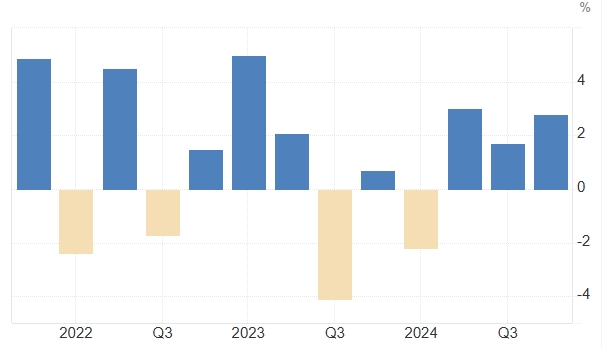
[US Retail Sales MoM, Source: Trading Economics]
The first retail sales report after Trump returned to the White House triggered market concerns. The retail sales month-on-month rate in January 2025 was -0.9%, the largest single-month decline since March 2023, far below the expected -0.2%. The market is worried that Trump's tariff policy is hitting the consumption prospects of the United States, and the risk of a US economic recession is resurfacing.
Combined with a number of weak data such as the subsequently announced PMI services index, the S&P 500 index fell from its record high and dropped 2.6% in the subsequent seven trading days.