Dow Jones Industrial Average briefly touches another record high on Thursday before tumbling
- Dow Jones rose into a fifth consecutive all-time high before receding on Thursday.
- Equities are paring back after a heady rally on rate cut hopes.
- September rate cut is fully priced in, Fed hold at the end of July expected.
The Dow Jones Industrial Average (DJIA) rallied into yet another record high on Thursday before turning lower and following the broader market into a soft pullback that dragged intraday prices back into the midweek range. The Dow Jones is trading firmly above the 40,000.00 major price handle after getting buoyed into all-time highs by investor expectations of a September rate cut getting pinned to the ceiling.
According to the CME’s FedWatch Tool, rate markets are pricing in over 98% odds of at least a quarter-point rate trim from the Federal Reserve (Fed) in September. Some particularly adventurous rate traders are pricing in a 5% chance of a first cut in July, but odds remain low at 5%.
Thursday’s Initial Jobless Claims print helped to keep rate cut hopes bolstered after the number of new jobless benefits seekers rose to 243K for the week ended July 12, well above the previous week’s revised 223K and vaulting over the forecast 230K. While jobless claims aren’t a market-mover, it helps add weight to expectations of a continued loosening in the US job market, a key component alongside inflation figures to help bully the Fed into a rate cutting cycle.
Dow Jones news
Despite easing back into the low end on Thursday, the Dow Jones is roughly on-balance, with about half of the index’s constituent equities in the green for the day. Intel Corp. (INTC) rose over 3% to $35.52 per share despite an overall decline in the chipmaking sector. Banking dominated the low end on Thursday, with JPMorgan Chase & Co. (JPM) and Goldman Sachs Group Inc. (GS) both declining. JPM shed -2.85% to $210.69 per share while GS eased lower -2.43% to $489.98 per share.
Dow Jones technical outlook
After hitting a fifth consecutive all-time high of 41,37138 on Thursday, the Dow Jones index eased back below 40,900.00 as bulls take a much-needed breather. The Dow Jones closed in the green for six straight trading days, rallying nearly 5.5% in the process.
The Dow Jones’ latest bullish push has sent prices well into record highs, and even Thursday’s moderate pullback of -300 points still leaves prices buried deep in bull country, trading nearly 4% above the 50-day Exponential Moving Average (EMA) at 39,345.00.
Dow Jones five minute chart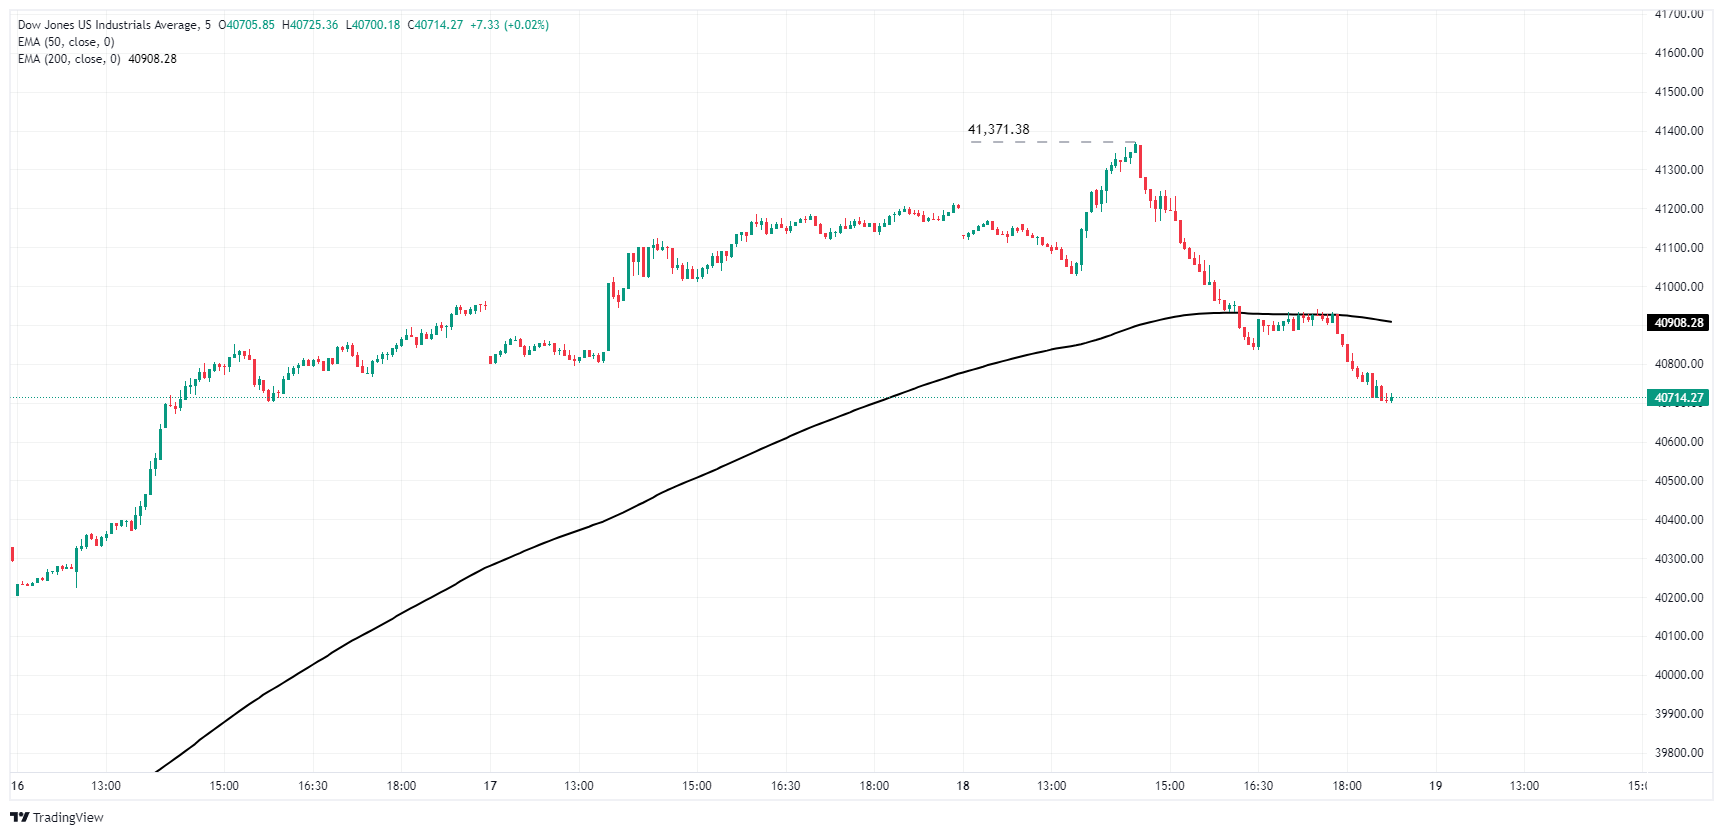
Dow Jones daily chart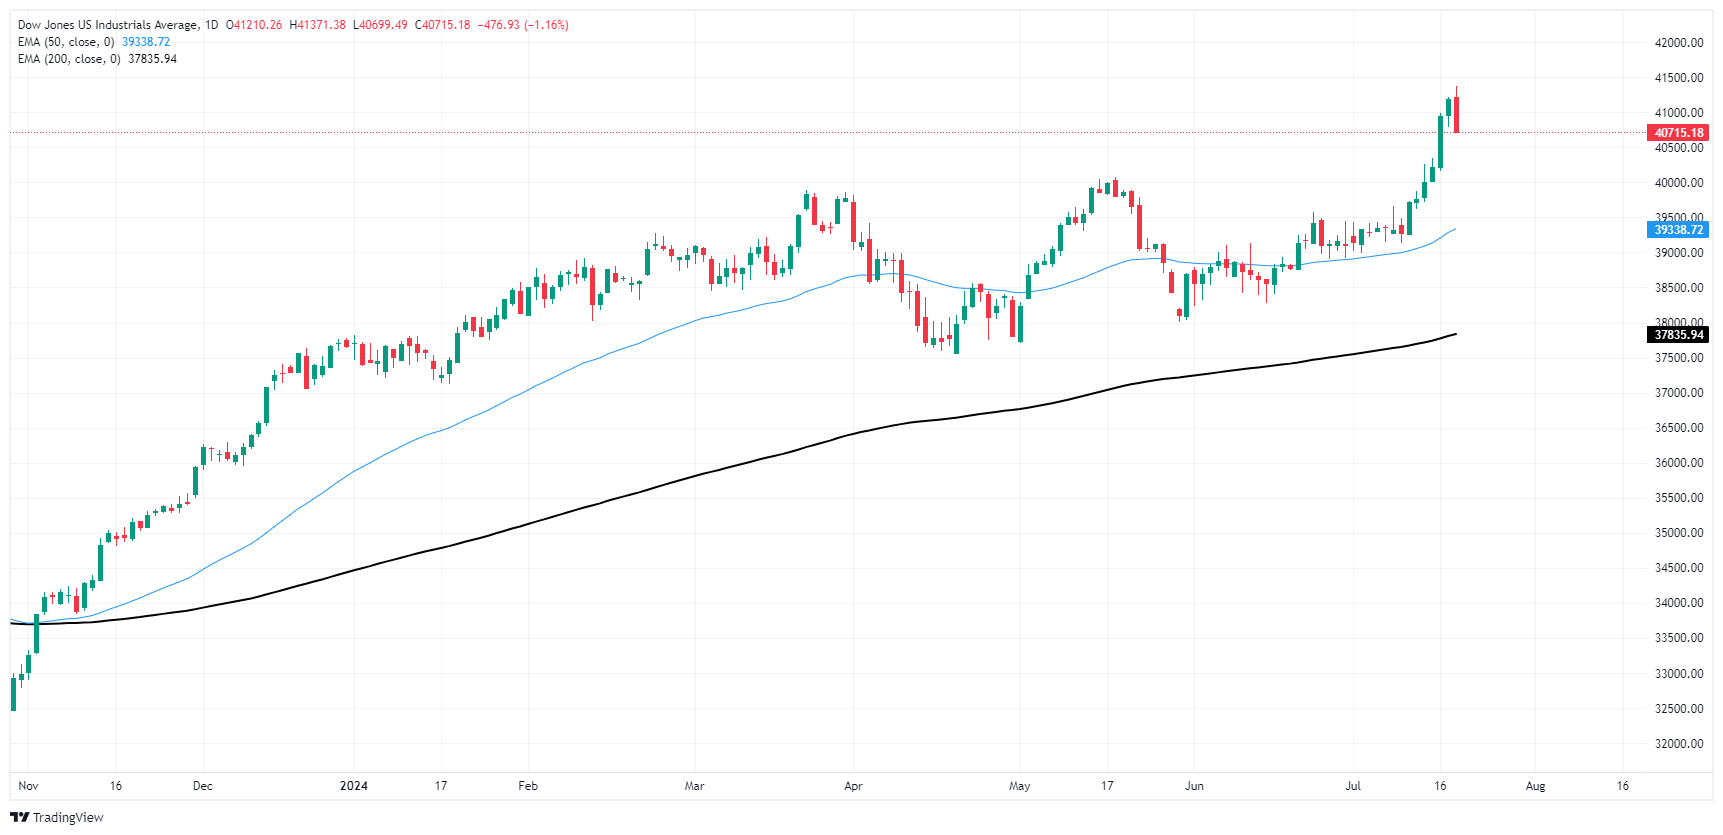
Economic Indicator
Initial Jobless Claims
The Initial Jobless Claims released by the US Department of Labor is a measure of the number of people filing first-time claims for state unemployment insurance. A larger-than-expected number indicates weakness in the US labor market, reflects negatively on the US economy, and is negative for the US Dollar (USD). On the other hand, a decreasing number should be taken as bullish for the USD.
Read more.Last release: Thu Jul 18, 2024 12:30
Frequency: Weekly
Actual: 243K
Consensus: 230K
Previous: 222K
Source: US Department of Labor
Every Thursday, the US Department of Labor publishes the number of previous week’s initial claims for unemployment benefits in the US. Since this reading could be highly volatile, investors may pay closer attention to the four-week average. A downtrend is seen as a sign of an improving labour market and could have a positive impact on the USD’s performance against its rivals and vice versa.
Related Articles
[IN-DEPTH ANALYSIS] Walmart (WMT): When a Strong Business Model Faces Economic Challenges
With growth further moderating and too many headwinds hitting the margins we would likely see stagnant to negative growth in earnings, which makes the current share price of $85.00 less attractive.
5 Things to Watch as Tencent Reports Its Q4 2024 Earnings
TradingKey - It has been a 2025 to celebrate so far for Chinese tech investors are China’s technology giants ride a wave of investor optimism. That’s in stark contrast to the huge sell-off happening in the US right now.
[IN-DEPTH ANALYSIS] PayPal's Stagnant Stock: Is $97 the Breakout Price for 2025?
TradingKey - PayPal is a leading digital payment platform that acts as an intermediary in the payment process, connecting merchants and consumers. Trusted brand with 434M users, 90M on Venmo, driving $1.68T TPV with strong cross-border reach.Boosted by e-commerce, mobile payments, emerging markets,