Dow Jones Industrial Average churns after still-cautious Fed flubs market hopes for tone shift
- Dow Jones struggles to shrug off early Fed-fueled declines.
- Fed comments came in more hawkish than expected, rattling investor sentiment.
- The long wait to Fed rate cuts continues as US inflation data looms ahead.
The Dow Jones Industrial Average (DJIA) tumbled in early Tuesday trading after Federal Reserve (Fed) Chairman Jerome Powell delivered less-dovish-than-expected talking points while testifying on the Fed’s semiannual Monetary Policy Report in the first of two appearances in as many days. A brief recovery rally after Tuesday's early dump failed to gain traction and bids are battling it out on the low end of the day's trading.
Forex Today: Focus remains on Powell and Fedspeak
On Tuesday, Fed Chairman Jerome Powell presented the Fed's semiannual Monetary Policy Report to the Senate Committee on Banking, Housing, and Urban Affairs. He emphasized the Fed's commitment to waiting for inflation to ease towards the 2% annual target, which disappointed investors hoping for signs of interest rate cuts. As a result, risk appetite decreased, and the US dollar strengthened.
Powell will deliver the second half of the report to the Congressional House Committee on Financial Services on Wednesday, and no changes in rhetoric or new information are expected.
Later this week, June's US Consumer Price Index (CPI) inflation is scheduled for Thursday, followed by Friday's US Producer Price Index (PPI) wholesale inflation. Core CPI in June is expected to remain at 3.4% YoY, while core PPI for the same period is projected to increase to 2.5% from the previous period's 2.3%. Meeting these forecasts may disappoint markets that are expecting a quarter-point rate cut from the Fed at the September 18 rate call due to the anticipation of slowing inflation.
Economic Indicator
Consumer Price Index ex Food & Energy (MoM)
Inflationary or deflationary tendencies are measured by periodically summing the prices of a basket of representative goods and services and presenting the data as the Consumer Price Index (CPI). CPI data is compiled on a monthly basis and released by the US Department of Labor Statistics. The MoM print compares the prices of goods in the reference month to the previous month.The CPI Ex Food & Energy excludes the so-called more volatile food and energy components to give a more accurate measurement of price pressures. Generally speaking, a high reading is seen as bullish for the US Dollar (USD), while a low reading is seen as bearish.
Read more.Next release: Thu Jul 11, 2024 12:30
Frequency: Monthly
Consensus: 0.2%
Previous: 0.2%
Source: US Bureau of Labor Statistics
The US Federal Reserve has a dual mandate of maintaining price stability and maximum employment. According to such mandate, inflation should be at around 2% YoY and has become the weakest pillar of the central bank’s directive ever since the world suffered a pandemic, which extends to these days. Price pressures keep rising amid supply-chain issues and bottlenecks, with the Consumer Price Index (CPI) hanging at multi-decade highs. The Fed has already taken measures to tame inflation and is expected to maintain an aggressive stance in the foreseeable future.
Dow Jones news
Over half of the Dow Jones' constituent securities finished Tuesday in the red, with banking stocks leading losses in early trading before a mild recovery that left Dow Inc. (DOW) as the loss leader. Dow backslid late in the day, falling -2.3% to $51.58 per share.
Intel Corp. (INTC) also saw a bullish break later in the US market session, bolstered by the ongoing AI bid afflicting the broader marketspace. Intel rose 1.77% to $34.59 per share.
Dow Jones technical outlook
Dow Jones initially plunged on Tuesday, dropping toward 39,120.00 before a sharp recovery rally to set an intraday high of 39,489.00. The DJIA is set to waffle around Tuesday’s opening bids near 39,360.00.
Daily candles continue to churn in the midrange as price action gets squeezed between the 50-day Exponential Moving Average at 38,998.14 and a supply zone priced in near the 40,000.00 major handle.
Dow Jones five minute chart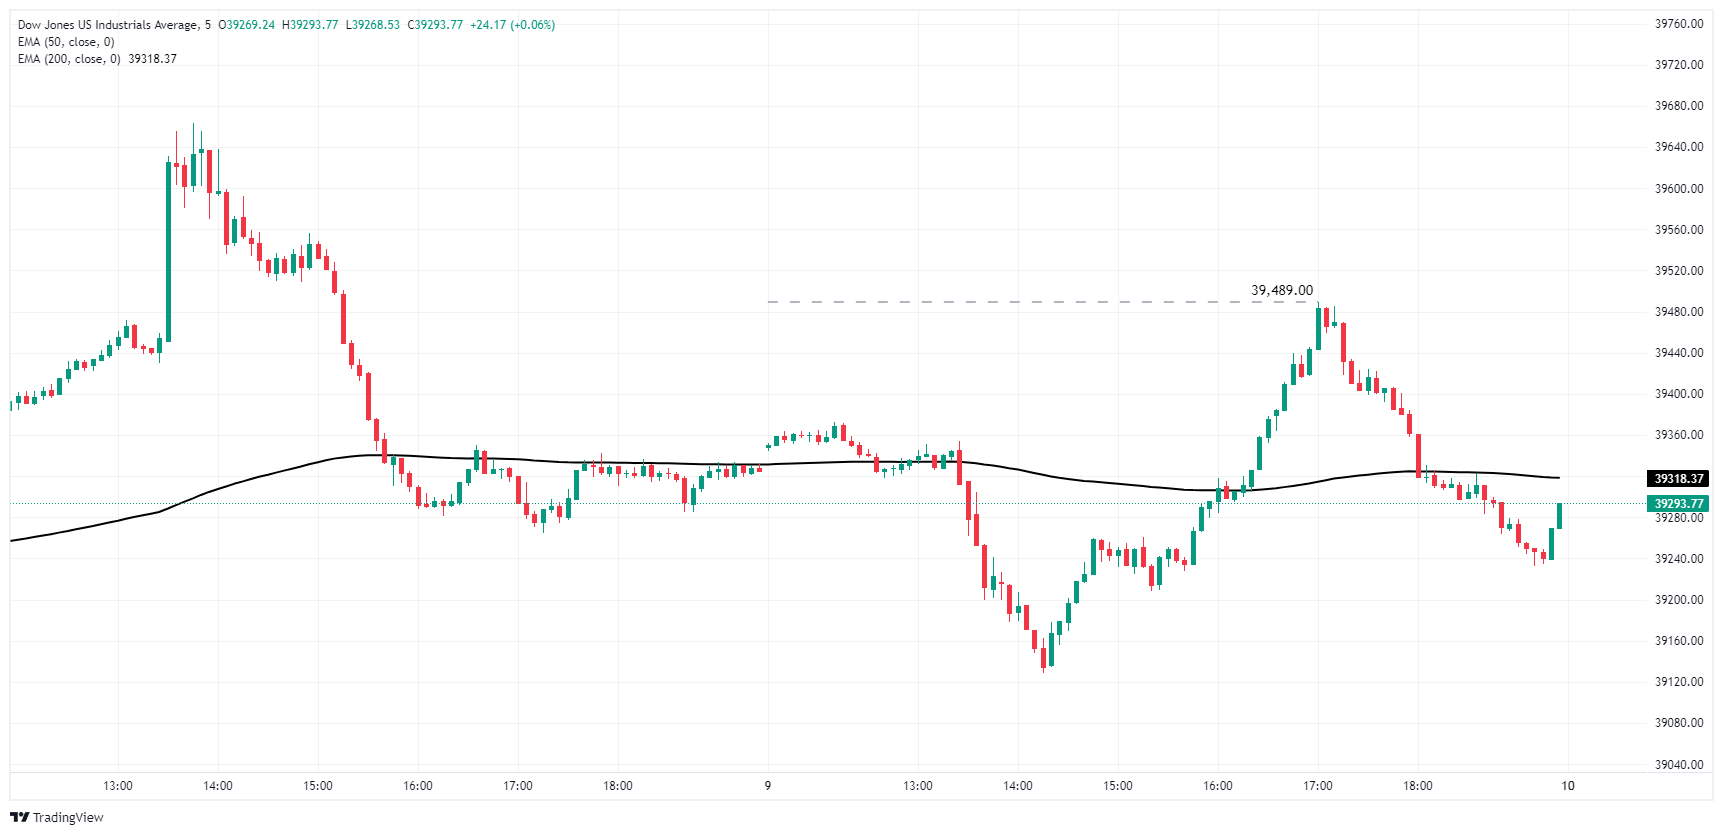
Dow Jones daily chart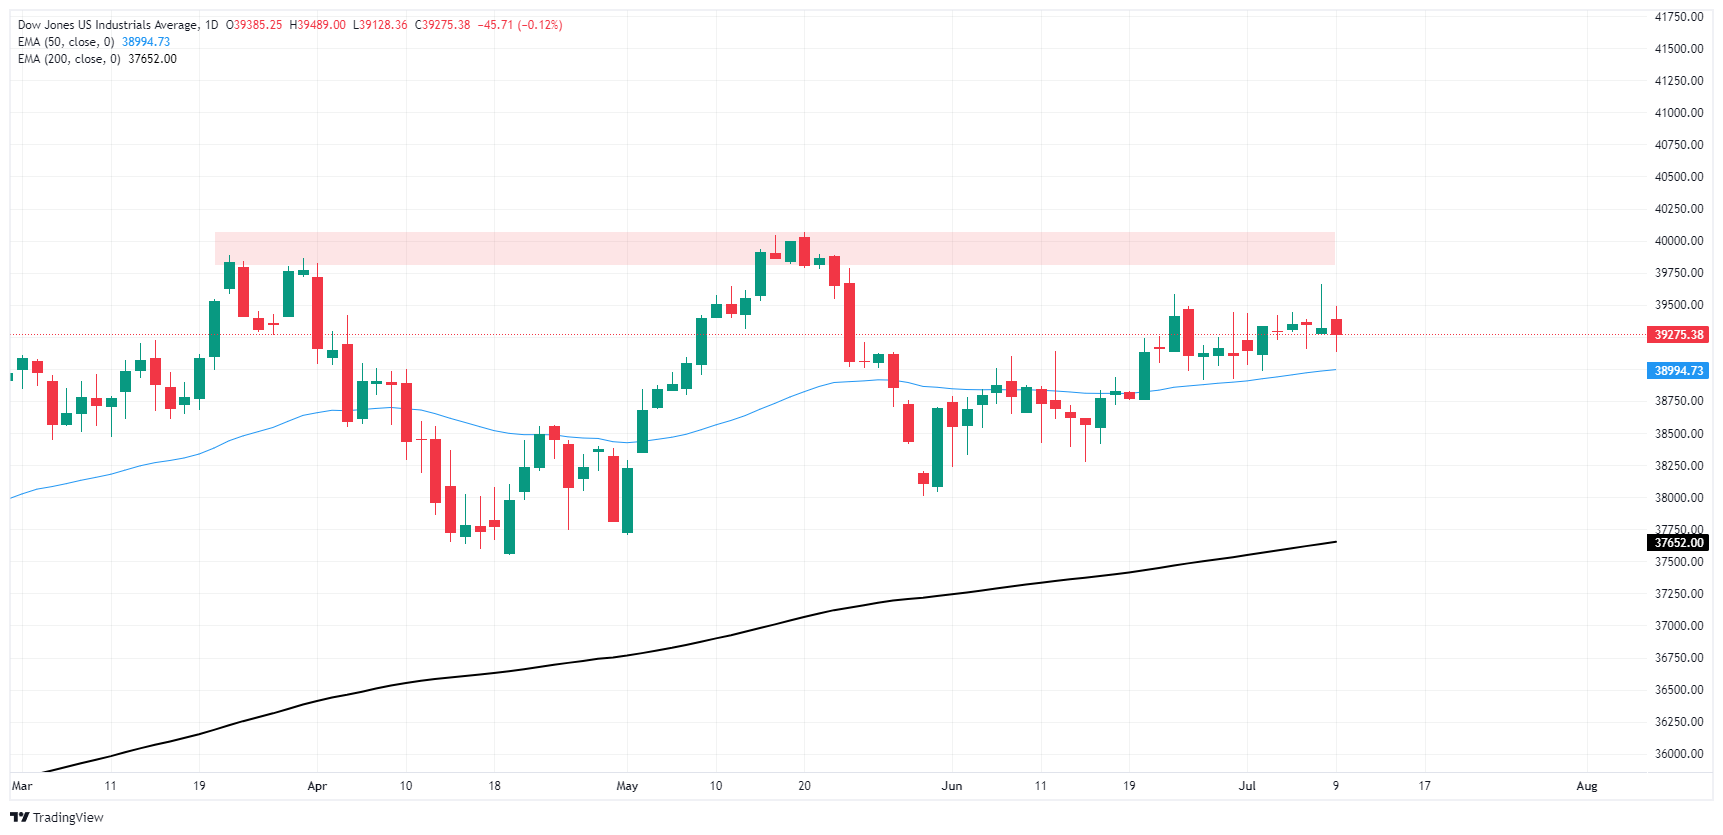
Related Articles
Bank of Japan Interest Rate Decision Preview: Pause on Rate Hikes Already Priced In, Minimal Market Movement Expected on the Day
On 19 March 2025, the Bank of Japan (BoJ) will announce its March interest rate decision. The market widely expects the central bank to maintain its policy rate unchanged at 0.5%. We align with this consensus forecast.
[IN-DEPTH ANALYSIS] Coinbase: The Next Chapter of Crypto from Trading to Consumer Apps
Our valuation estimates its intrinsic worth at $75–$87 billion, suggesting meaningful upside potential from its current market cap of $50 billion. While risks such as regulatory uncertainty and crypto market volatility remain, Coinbase’s diversified revenue streams and strong execution capabilities
[IN-DEPTH ANALYSIS] Walmart (WMT): When a Strong Business Model Faces Economic Challenges
With growth further moderating and too many headwinds hitting the margins we would likely see stagnant to negative growth in earnings, which makes the current share price of $85.00 less attractive.