Dow Jones Industrial Average pushes into the green on Monday
- Dow Jones is the clear winner of the major US equity indexes on Monday.
- The Dow Jones is up over three-quarters of one percent to kick off the trading week.
- Key US data data due later in the week as rate cut hopes grip September.
The Dow Jones Industrial Average (DJIA) gained ground on Monday, extending a near-term rebound and on pace to see one of its best single-day performances in June. Treasuries are holding flat and investor sentiment, while mixed, is holding broadly in place as rate cut hopes continue to hold out for a September rate trim.
Fed's Daly: Inflation is not the only risk, but recent inflation readings are more encouraging
Key US data looms ahead later in the week, with an update to annualized US Gross Domestic Product (GDP) for the first quarter on Thursday and a new print of US Personal Consumption Expenditure (PCE) Price Index inflation slated for Friday. Investors will broadly be looking for cooling inflation metrics and slightly soft economic figures to drive the Federal Reserve (Fed) towards a rate cut in September, but both too-good and too-bad figures will spark a dogpile into safe havens.
Dow Jones news
The Dow Jones is broadly higher on Monday, with over two-thirds of the index’s securities seeing green to kick off the new trading week. Salesforce Inc. (CRM) still struggled on the day, backsliding -1.75% and falling to $240.00 per share as the digital management software company struggles to capitalize on the broad-market AI splurge.
Familiar crowd favorites Chevron Corp. (CVX), Amgen Inc. (AMGN), and International Business Machines Corp. (IBM) are all up over 2% on the day as investor appetite bids up the big name houses. Chevron rose above $158.00 per share, with Amgen climbing to $314.81 and IBM testing $176.00 per share.
Dow Jones technical outlook
The Dow Jones tested a fresh five-week high on Monday, clipping into 39,581.81 before cooling off in the back half of the day’s US market session. The index has climbed 4% after hitting a near-term bottom at the 38,000.00 handle.
There is still plenty of ground to cover before bulls can pierce into new all-time highs above the 40,000.00 major handle, but shorts will have an equally hard time pushing back to major long-term technical support at the 200-day Exponential Moving Average (EMA) at 37,462.29.
Dow Jones five minute chart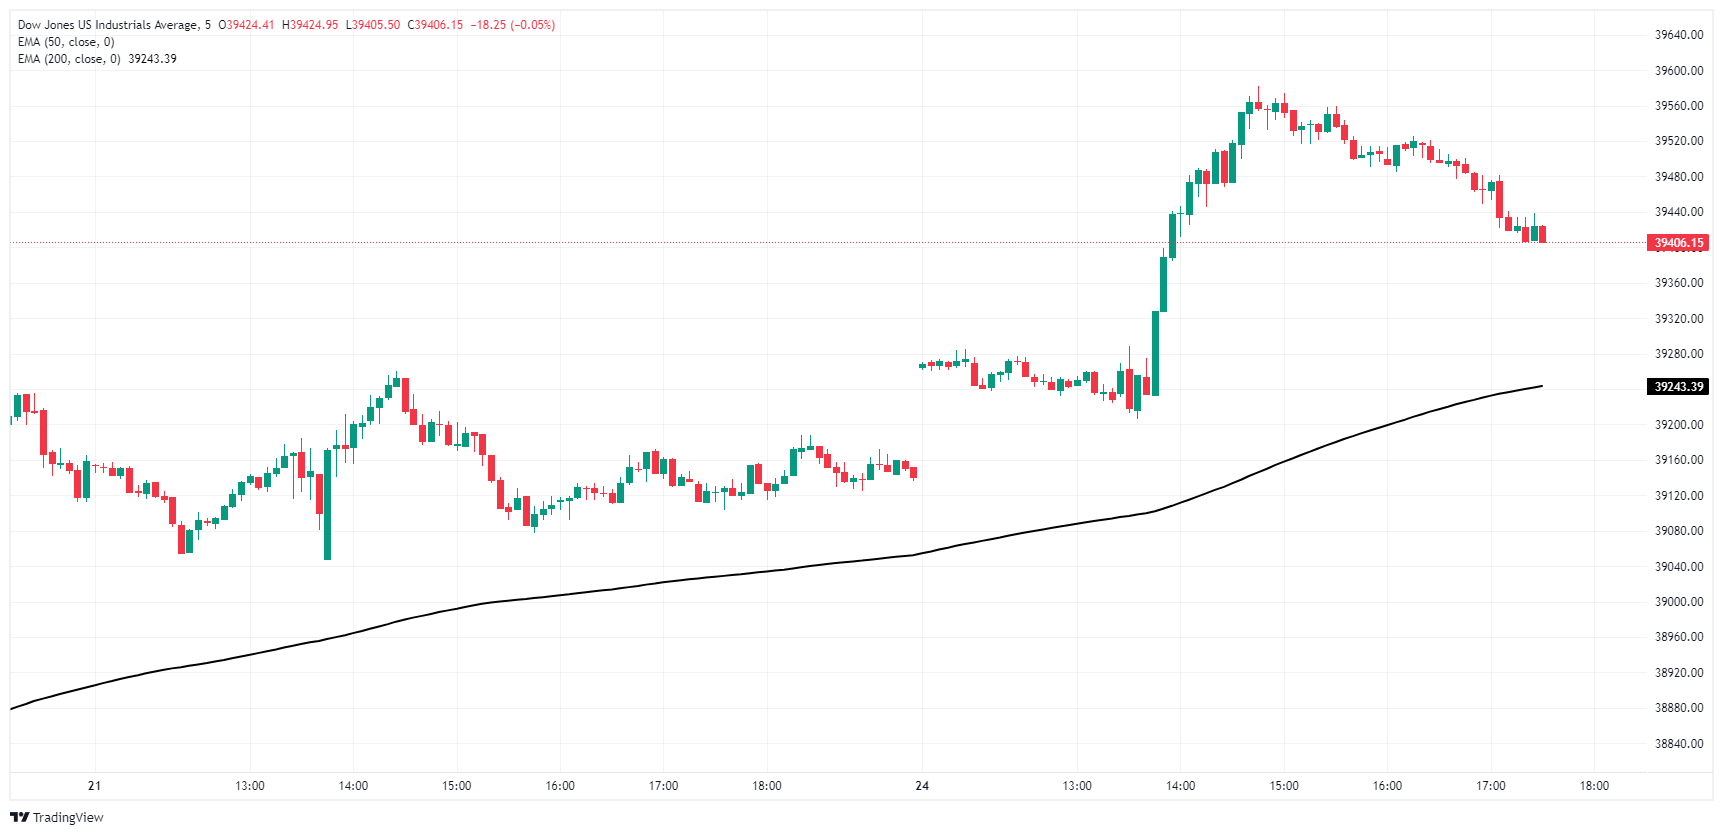
Dow Jones daily chart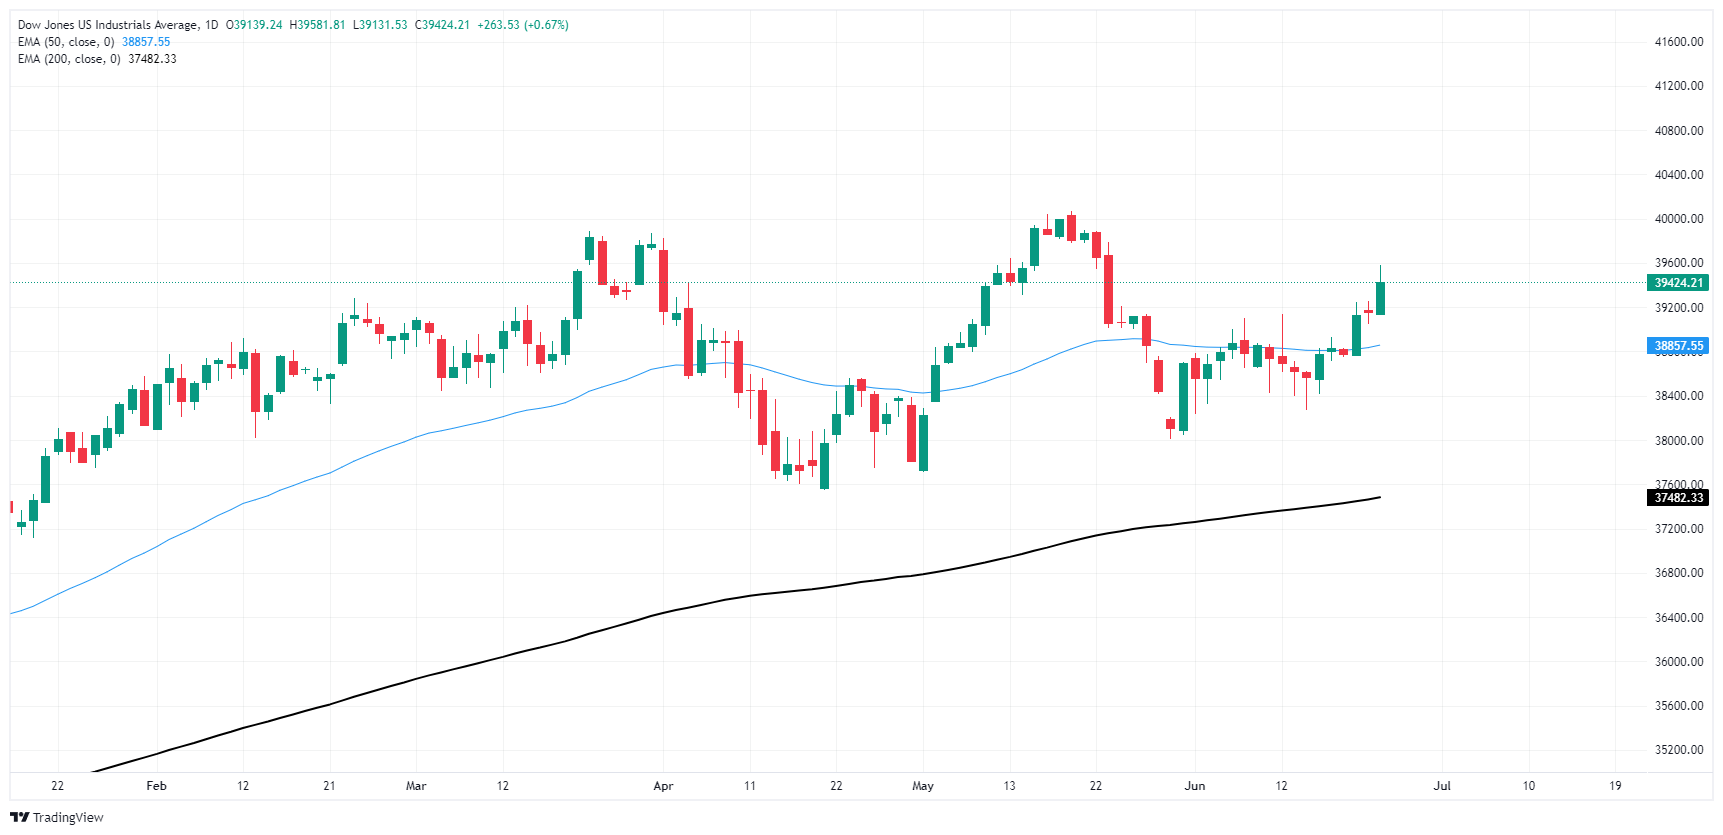
Economic Indicator
Core Personal Consumption Expenditures - Price Index (MoM)
The Core Personal Consumption Expenditures (PCE), released by the US Bureau of Economic Analysis on a monthly basis, measures the changes in the prices of goods and services purchased by consumers in the United States (US). The PCE Price Index is also the Federal Reserve’s (Fed) preferred gauge of inflation. The MoM figure compares the prices of goods in the reference month to the previous month.The core reading excludes the so-called more volatile food and energy components to give a more accurate measurement of price pressures. Generally, a high reading is bullish for the US Dollar (USD), while a low reading is bearish.
Read more.Next release: Fri Jun 28, 2024 12:30
Frequency: Monthly
Consensus: 0.1%
Previous: 0.2%
Source: US Bureau of Economic Analysis
After publishing the GDP report, the US Bureau of Economic Analysis releases the Personal Consumption Expenditures (PCE) Price Index data alongside the monthly changes in Personal Spending and Personal Income. FOMC policymakers use the annual Core PCE Price Index, which excludes volatile food and energy prices, as their primary gauge of inflation. A stronger-than-expected reading could help the USD outperform its rivals as it would hint at a possible hawkish shift in the Fed’s forward guidance and vice versa.
Related Articles
A Shift from Hardware to Software in the AI Industry Cycle - These AI Software Stocks Deserve Attention!
TradingKey – The rapid development of artificial intelligence (AI) technology has shifted the spotlight from proprietary models like ChatGPT to open-source alternatives like DeepSeek in just a few years. Capital markets are now pricing in a new AI cycle: the transition from the AI hardware era to...
Bank of Japan Interest Rate Decision Preview: Pause on Rate Hikes Already Priced In, Minimal Market Movement Expected on the Day
On 19 March 2025, the Bank of Japan (BoJ) will announce its March interest rate decision. The market widely expects the central bank to maintain its policy rate unchanged at 0.5%. We align with this consensus forecast.
[IN-DEPTH ANALYSIS] Coinbase: The Next Chapter of Crypto from Trading to Consumer Apps
Our valuation estimates its intrinsic worth at $75–$87 billion, suggesting meaningful upside potential from its current market cap of $50 billion. While risks such as regulatory uncertainty and crypto market volatility remain, Coinbase’s diversified revenue streams and strong execution capabilities
[IN-DEPTH ANALYSIS] Walmart (WMT): When a Strong Business Model Faces Economic Challenges
With growth further moderating and too many headwinds hitting the margins we would likely see stagnant to negative growth in earnings, which makes the current share price of $85.00 less attractive.