


TradingKey – In forex trading, breakout and reversal strategies are critical.
Does a price breakout signal trend continuation or a trap? When a reversal pattern appears, how do you capture it with precision?
This requires not only understanding technical indicators and candlestick patterns but also insight into market dynamics. When opportunity knocks, will you be ready?
What Is Breakout Trading?
Imagine staring at a chart for hours, watching prices oscillate within a tight range without breaking out.
Then, suddenly, it erupts — a powerful bullish candle surges upward, or a bearish candle smashes downward.
This is the essence of breakout trading.
What Defines a Breakout?
A breakout occurs when the price finally "breaks away from a state of consolidation."
For example:
A stock has been stuck below a resistance level for days — suddenly, it surges past it.
Price has been trapped in a triangle or rectangle pattern, and then it violently breaks out in one direction.
The core logic of breakout trading is straightforward: Wait for the price to break a key level or pattern, then enter the trade in the breakout direction, anticipating a new trend.
(Source: Shutterstock)
What Key Elements Should You Focus On?
Identifying Key Support and Resistance Levels, as well as Price Patterns
Price movement is never completely random. It often tests, bounces, or gets blocked at certain levels — these are known as key support and resistance zones.
For example, previous highs, lows, or round-number levels often act as psychological barriers. Once the price successfully breaks through these areas, it usually signals that a new trend may be about to begin.
In addition, you can identify common chart patterns by observing price action, such as ascending triangles, head-and-shoulders formations, or flag patterns. When these setups break, they often lead to meaningful price moves.
Volume Is the Key Signal for Confirming Breakouts
Don’t judge a breakout just by price alone — volume is what confirms whether the move is real.
If prices increase while volume remains unchanged, the breakout could be misleading.
A valid breakout typically comes with a noticeable increase in volume, indicating that real market participation has picked up and more capital is flowing in.
Timeframe Selection Matters
Are you a short-term trader or a trend follower? This helps identify the timeframe you should concentrate on.
If you trade on daily or weekly charts, you’re better off waiting for stronger, more reliable breakout signals.
These setups may occur less frequently, but when they do, they often result in longer-lasting and more profitable trends.
If you prefer intraday trading, shorter timeframes like hourly or minute-level charts may suit you better.
Just be careful — false breakouts are much more common in these timeframes, and one wrong move can easily lead to losses.
What Is Reversal Trading?
When many people hear the term “reversal trading,” their first thought is often: “Isn’t this going against the market?”
Yes, reversal trading may seem a bit “counterintuitive” at first glance — but it’s not about blindly buying the bottom or selling the top. It’s about waiting for clear signals that suggest a trend is about to reverse, and then acting accordingly.
Trends don’t last forever — they always come to an end at some point. When the price reaches an extreme area and shows strong signs of reversal, that’s when you start paying attention.
How Do You Identify Reversal Signals?
The most critical part of reversal trading is determining whether the trend is truly ending, not just pausing.
There are many fake signals in the market — for example, a price breaks through a key level but quickly reverses. Jumping in too early can easily get you trapped.
Here are some common reversal signals:
Candlestick patterns, such as those discussed earlier (e.g., engulfing candles, hammer, shooting star), visually reflect shifts in market sentiment.
Technical indicators like RSI and KDJ help identify overbought or oversold conditions.
Moving average crossovers and trendline breaks also serve as useful supporting signals. For instance, if the moving average starts to turn around, or the price breaks below/above a trendline, it could signal a possible change in direction.
It's best to combine these tools and analyze them together with current market sentiment — only then can you improve your chances of success.
.jpg)
(Source: Shutterstock)
How to Spot the Best Reversal Entry Point?
Spotting a reversal pattern is just the first step. The real challenge lies in timing your entry correctly.
There’s no one-size-fits-all answer, but here are several factors you can consider:
First, look at the overall market environment. Around major data releases or economic events, sentiment tends to swing, making trends more likely to pause or reverse.
Also, after a long period of sustained upward or downward movement, markets often experience pullbacks or corrections — these are prime opportunities for spotting reversals.
Second, take timeframes into account.
Daily chart reversal signals tend to be more reliable, though less frequent.
Signals on hourly or minute charts appear more often, but they’re also harder to trust — false moves are common, and mistakes happen easily.
Therefore, choose the right timeframe based on your trading style — whether you're a short-term, medium-term, or long-term trader.
How to Safely Trade Reversals Amid the Risk?
Reversal trading does carry a higher risk than trend following, because you're essentially betting against the prevailing market direction.
That’s why risk management must come first.
Start by setting a reasonable stop-loss. Use key support/resistance levels or previous highs/lows as reference points. This way, even if your call turns out wrong, your losses stay under control.
Position sizing is also crucial. Don’t go all-in or trade large sizes based on just one reversal signal. No one gets every move right — proper position sizing ensures you survive the misses and stay in the game longer.
.jpg)
(Source: Shutterstock)
Common Reversal Trading Strategies You Can Try
Strategy 1: Reversal Based on Overbought and Oversold Conditions
When the RSI rises above 70 and the KDJ shows signs of high-level flattening, it suggests that the market may have overextended to the upside — a pullback could be near. This situation can present a favorable chance to think about shorting.
Conversely, when RSI drops below 30 and market sentiment turns extremely bearish, it may signal a potential bottom, offering a chance to buy the dip.
However, keep in mind that overbought or oversold conditions can last longer than expected. Relying solely on indicator values to trade reversals often leads to losses. Always combine these signals with candlestick patterns and divergence for confirmation.
For example, if you see price making a new high but RSI fails to follow, this divergence is a strong warning sign worth paying attention to.
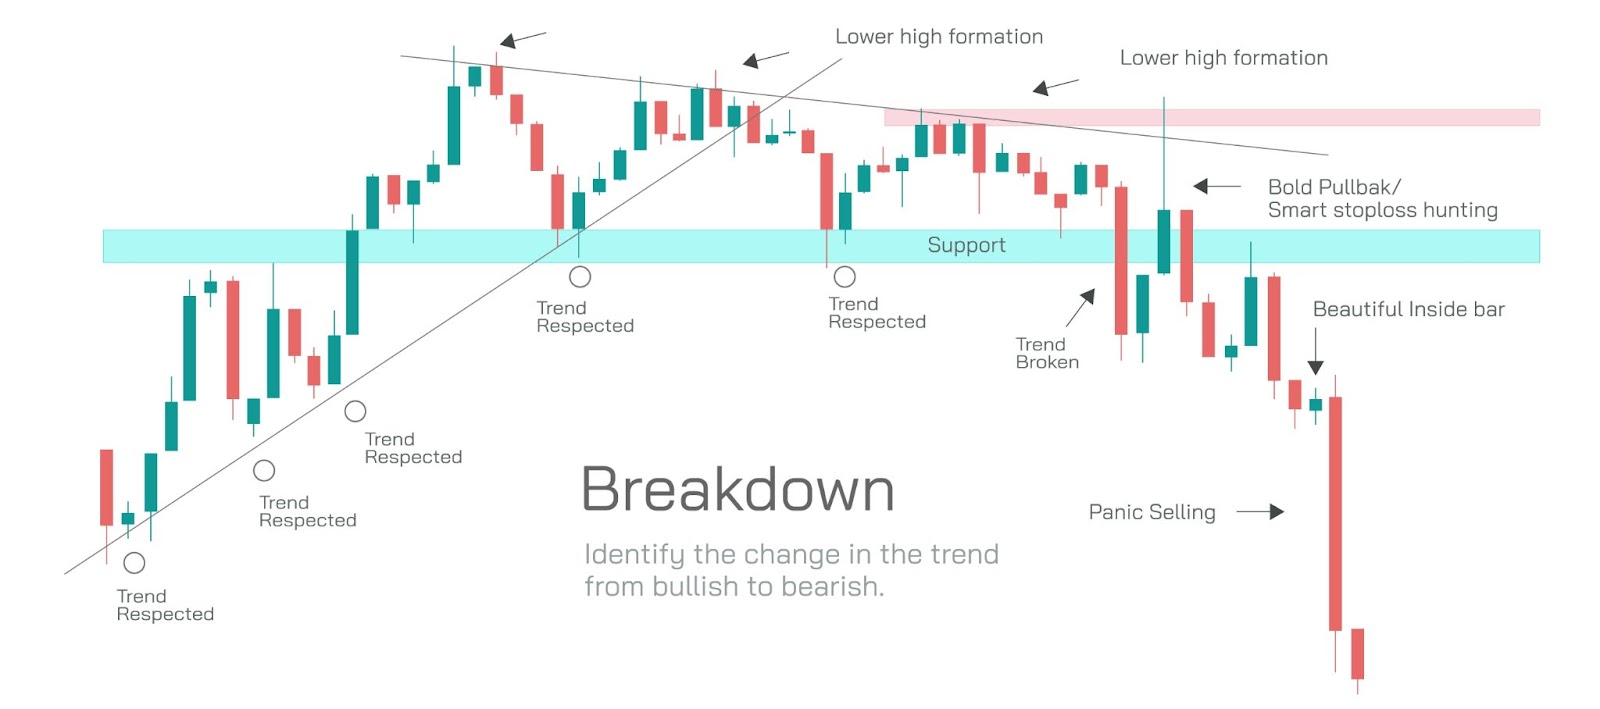
Strategy 2: Trendline Break as a Reversal Signal
Trendlines act as psychological barriers for many traders. Once price breaks through or falls below a trendline, it often signals a shift in market sentiment.
In an uptrend, if the price suddenly breaks below the rising trendline, it could indicate a reversal is underway. Likewise, during a downtrend, a breakout above the descending trendline might indicate a potential buying opportunity.
But don’t rush in immediately. Watch whether volume increases and whether price can stabilize above the broken trendline. If the price successfully retests and maintains its position on the trendline, the likelihood of a genuine reversal rises considerably.
