[IN-DEPTH ANALYSIS] TSMC: Forging the Future of Chips with Unmatched Scale and Innovation

Key Takeaways
- Market Leader: TSMC’s dominant market share and client lock-in from global giants ensure pricing power and resilience, outpacing Samsung and Intel.
- Tech Edge: The 2nm rollout solidifies TSMC’s lead, meeting surging AI and HPC needs with superior efficiency and scale.
- Growth Ahead: A 20% revenue jump in 2025, backed by fabless demand and capacity growth, supports a target price range of $190-$263, promising strong returns.
TSMC dominate the global foundry market, holding a 62% share of the 2024 foundry market, far ahead of competitors like Samsung at 10% and Intel Foundry Services, part of the U.S.’s 6%. Together with other Taiwanese firms like UMC and VIS, Taiwan controls over 70% of the industry, making it the hub of global chip production. Samsung’s share has dropped from higher levels in recent years due to yield issues, while Intel’s foundry business is still in the early stages. China’s SMIC, at 5%, is growing but trails in cutting-edge technology.
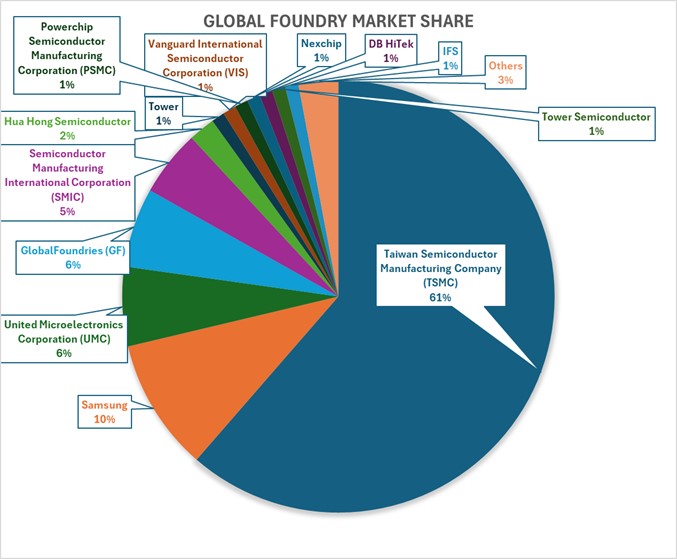
Source: Visual Capitalist, Tradingkey.com
TSMC’s market leadership translates into pricing power and client lock-in. With 90%+ of its revenue from international giants (Apple, Nvidia, AMD), TSMC is less a Taiwanese firm and more a global linchpin. This dominance shields it from cyclical downturns, as demand for advanced chips—especially AI-driven—continues to outstrip supply.
Technological Leadership: 2nm and Beyond
TSMC’s technological edge is its crown jewel, with 2nm mass production slated for H2 2025, followed by enhanced variants (N2P, N2X) in 2026 and the groundbreaking A16 (1.6nm) by late 2026. This roadmap keeps TSMC ahead of Samsung and Intel, particularly as it transitions from FinFET to GAAFET architecture.
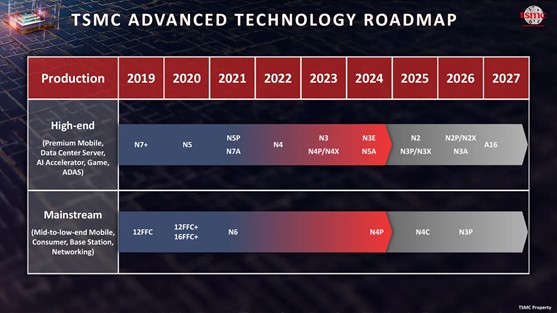
Source: TSMC
- 2nm (N2): Using GAAFET (Gate-All-Around FET) nanosheet transistors, N2 offers 10-15% performance gains or 25-30% power reduction over N3E (second-gen 3nm), with a 15%+ density boost. Building on its success with FinFET transistors at 3nm, where it achieved 90% yields, TSMC transitioned to GAAFET methodically, sidestepping Samsung’s rushed attempt at 3nm GAAFET that resulted in only 20% yields and production setbacks. The addition of NanoFlex gives customers like Nvidia and Apple the ability to fine-tune chip designs for speed, efficiency, or size, reinforcing TSMC’s lead in delivering high-quality, customizable solutions.
- A16 Innovation: With Super Power Rail (SPR) backside power delivery (BSPDN), A16 delivers 8-10% speed gains or 15-20% power savings over N2P, plus a 7-10% density increase. SPR connects power directly to transistor source/drain, making it the most advanced and complex BSPDN variant—outpacing Intel’s PowerVia and Imec’s Buried Power Rail in efficiency.
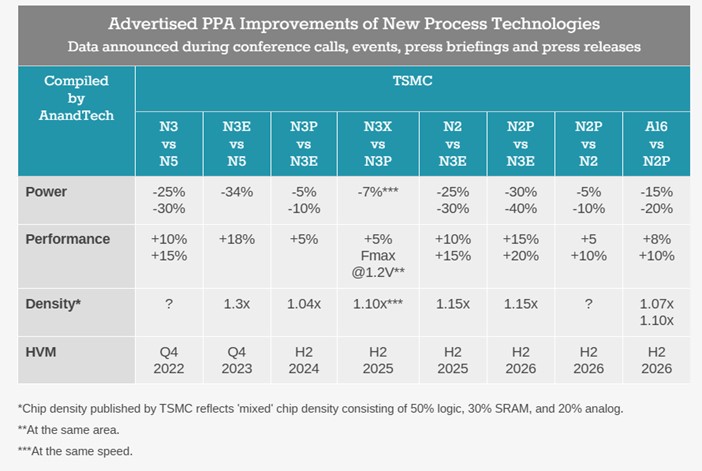
Source: AnandTech
TSMC 2nm vs. Intel 18A
Intel’s 18A (1.8nm), set for H2 2025, has garnered buzz for closing the gap with TSMC. TechInsights pegs 18A at 238 MTr/mm² vs. TSMC’s N2 at 313 MTr/mm², a 32% density advantage for TSMC. Intel claims performance leadership via PowerVia, but this is unproven at scale, and its foundry lacks TSMC’s client base and production polish. TSMC’s 2nm ecosystem, bolstered by NanoFlex and higher yields, will likely maintain its edge in cost-efficiency and adoption, relegating Intel to a niche HPC play.
TSMC’s tech lead isn’t just about numbers—it’s about execution. With 2nm tape-outs expected to exceed 3nm and 5nm in their first two years, TSMC’s ability to deliver power-efficient, dense chips positions it as the go-to for AI, 5G, and next-gen smartphones. Intel’s 18A may narrow the gap, but TSMC’s scale and client trust keep it ahead.
Wafer Shipments and Capacity: Scale Meets Demand
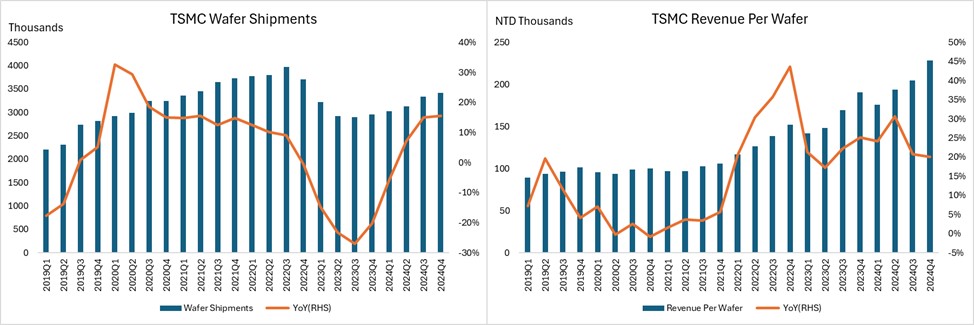
TSMC’s production scale is a cornerstone of its dominance, with installed capacity exceeding 16 million 12-inch equivalent wafers in 2024, TSMC’s infrastructure, spanning Taiwan, Arizona, and Japan fabs, capable of meeting surging demand for advanced nodes. Looking ahead, TSMC targets 100,000 wafers/month for 2nm by late 2025, pushing capacity toward 18 million by 2026.
Source: Company Financials, Tradingkey.com
- Capacity Leadership: TSMC’s >16 million wafer capacity in 2024 is far exceeding Samsung and Intel IFS, solidifying its ability to service global demand, particularly for AI and HPC. The gap between capacity (16M+) and shipments (13-13.5M) reflects a strategic buffer, allowing TSMC to ramp 2nm without bottlenecks. This scale, paired with 70% CapEx allocation to advanced nodes, positions TSMC to capture more market.
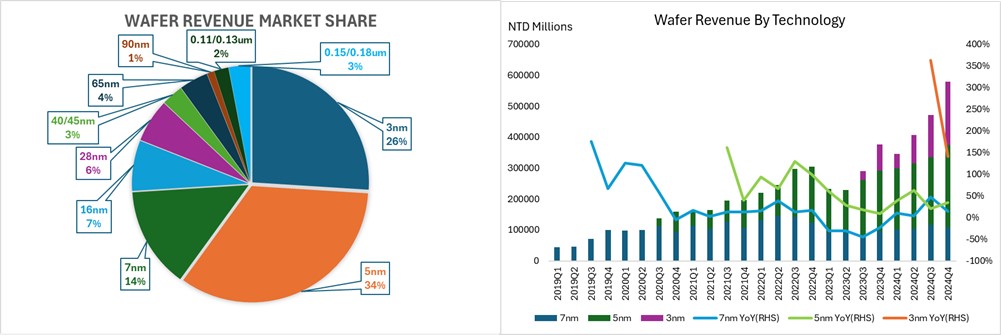
- Node Transition Dynamics: The transition to 3nm technology, which made up 26% of Q4 revenue, is following a similar pattern to previous transitions, like 7nm reaching 27% in 2019. However, 2nm technology offers over 15% higher density and 25-30% power savings compared to 3nm (N3E), which suggests it will grow faster. With more tape-outs expected in the first two years compared to 3nm and 5nm, 2nm could account for 30-35% of revenue by 2027. As production improves and yields increase, profit margins could rise to around 60%.
- Pricing Power: Advanced node scarcity drives wafer prices—3nm at <$20,000, 2nm at ~$30,000 according to TechInsights as clients compete for slots. This dynamic offsets rising CapEx and power costs, ensuring profitability.
Source: Company Financials, Tradingkey.com
CoWoS Capacity
TSMC’s Chip-on-Wafer-on-Substrate (CoWoS) advanced packaging stands as a high-margin growth driver, with Nvidia securing over 70% of CoWoS-L capacity in 2025. Shipments are increasing by more than 20% quarter-over-quarter, with plans to significantly scale annual output by 2026, driven by robust demand for Nvidia’s Blackwell GPUs and AMD’s MI300X. CoWoS contributed 8% to TSMC’s 2024 revenue, with targets set to reach 10-12% in 2025 and potentially 15% by 2027, boasting margins above the company’s 56.1% average. Capacity for this technology doubled from 2023 to 2024, reflecting its critical role in meeting AI-focused needs.
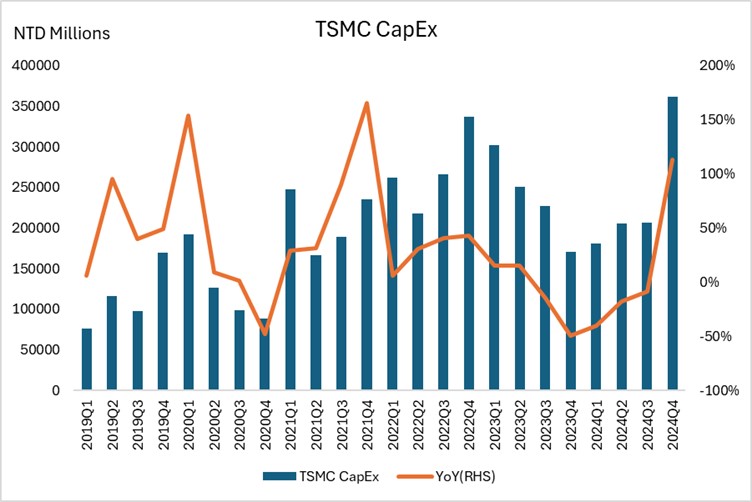
This growth is supported by TSMC’s expected 2025 capital expenditure (CapEx), which rises 28-41% from 2024 levels:
- 70% allocated to advanced nodes (2nm, A16) to expand wafer production capacity.
- 10-20% directed to specialty technologies, including Japan’s fab expansion.
- 10-20% invested in CoWoS enhancements and mask production to address packaging demand.
Source: Company Financials, Tradingkey.com
Revenue Breakdown by Platform: Trends and Predictions
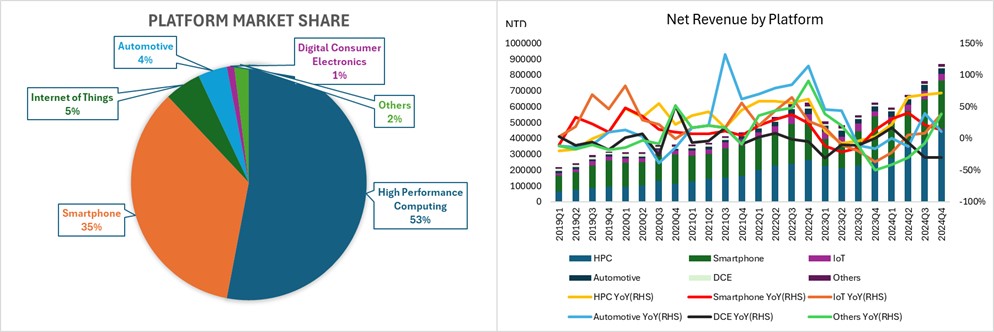
From TSMC's revenue composition, its business model has undergone significant changes since 2022, with high-performance computing (HPC) surpassing smartphones as the main source of revenue, while other segments like IoT, automotive, and consumer electronics play supporting roles.
Source: Company Financials, Tradingkey.com
HPC Surge: The AI Revolution
In 2024, the revenue of high-performance computing (HPC) grew by 58% year-over-year, leading all platforms in growth rate, primarily driven by strong demand for AI accelerators, with Nvidia being a major driving force, reflecting the shift from traditional server CPUs to specialized AI GPUs, ASICs, and HBM controllers for data center training and inference. This demand is expected to stay strong in 2025 as big firms like Meta continues heavy CapEx spending, which will translate to Nvidia’s demand, thus increasing TSMC’s demand, but over the next two to three years, TSMC could see a demand dip if AI growth slows after its current boom.
Smartphone Recovery: Resilience, Not Dominance
Smartphones, once TSMC’s backbone, bottomed out at 30% share in 2021-2022 amid post-pandemic saturation and weaker 5G uptake. The 23% YoY growth in 2024 signals a recovery, driven by Apple’s A17/A18 chips (3nm/2nm), Qualcomm’s Snapdragon refresh, and 5G penetration in emerging markets like India. Historical peaks won’t return, but smartphones remain a steady cash cow.
IoT and Automotive: Steady
The IoT and automotive sectors play significant roles in the chip market. IoT revenue is stable at about 5%, but growth is limited due to commoditization of 16nm and 7nm chips. In contrast, the automotive sector, accounting for 1%, remains stable thanks to sustained demand for electric vehicles (EVs) and advanced driver-assistance systems (ADAS). While both sectors are stable, IoT growth is constrained, and automotive stability depends on continued demand for specific technologies.
Additional, TSMC also expects fabless semiconductor inventory, including key clients like MediaTek, Qualcomm, Broadcom, Nvidia, and AMD, to stabilize at healthier levels by the end of 2024. After clearing excess stock from 2022-2023—driven by strong AI and 5G demand—these companies are poised to ramp up orders in 2025, fueling TSMC’s projected revenue growth of around 20%.
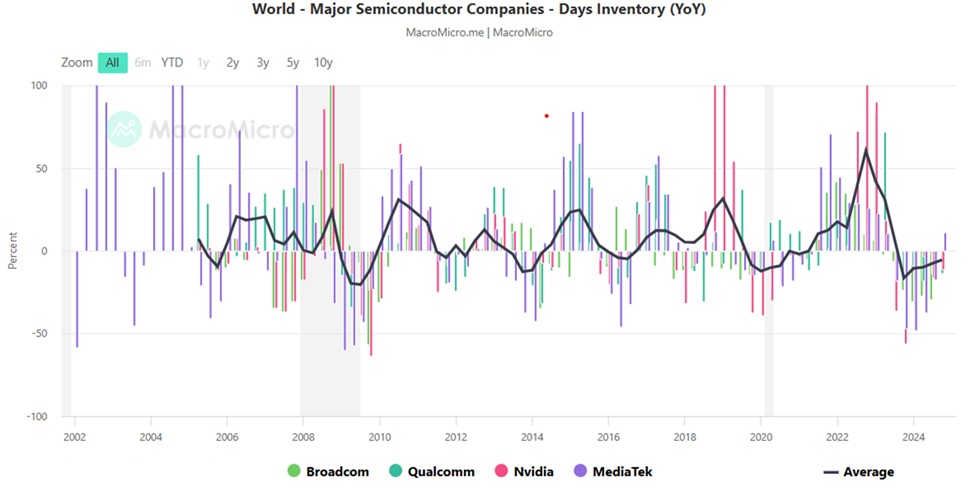
Source: MacroMicro
Revenue by Region: Trends and Global Push
TSMC’s 2024 revenue distribution reflects its North American tilt and strategic diversification. North America’s 75% share trajectory aligns with AI/HPC demand. Asia Pacific’s decline is offset by Japan/Europe gains.
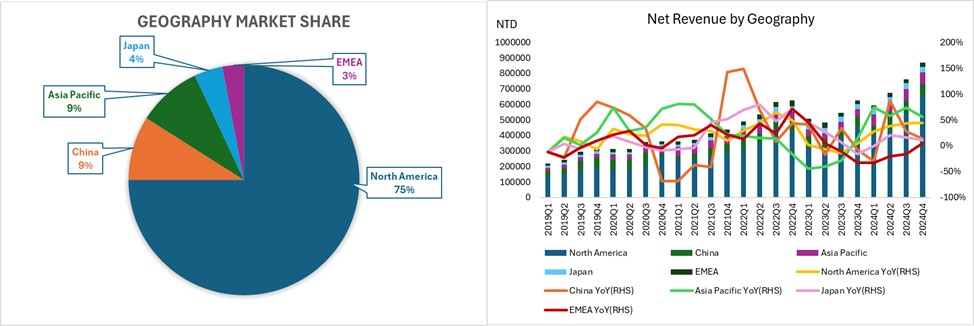
Source: Company Financials, Tradingkey.com
U.S. Expansion: Geopolitical Hedge
North America’s 75% share reflects TSMC’s U.S.-centric client base and fab push. Arizona Fab 1 (4nm) began mass production in Q4 2024, with yields matching Taiwan’s. Fab 2 (3nm/2nm) is slated for 2028, and Fab 3 breaks ground in June 2025, potentially adopting A16 by 2029, reducing Taiwan exposure amid geopolitical risks.
Japan and Europe: Diversification
Japan’s Kumamoto Fab 1 began production in 2024, with Fab 2 set to follow in 2027, while Europe’s revenue share expands through the Dresden facility, focused on automotive and industrial applications, starting in 2027. These expansions could boost their regional contributions by 2028, driven by steady growth rates as specialty nodes and advanced 2nm technology tap into niche markets like imaging and automotive systems from key players such as Sony and Bosch.
Valuation
TSMC’s dominance in the global foundry market, powered by its advanced 2nm technology and growing CoWoS packaging, sets it up for strong growth through 2029. Demand for AI and high-performance computing chips from major clients like Nvidia, AMD, and Qualcomm drives this expansion. The company’s 2025 CapEx, projected to rise 28-41% from 2024, will fund this growth, though it may squeeze short-term free cash flow. Using a DCF analysis based on revenue and profit trends, we estimate a target ADR range of $190-$263 USD:
- Base Case ($218): Revenue grows 25% in 2025 with a 14% compound annual growth rate (CAGR) through 2029 and a 56% gross margin, offering a 20% upside with steady AI and HPC demand balanced against CapEx costs.
- Bull Case ($263): Revenue jumps 30% in 2025, with an 18% CAGR and 58% gross margin, delivering a 45% upside if AI adoption and 2nm/CoWoS performance hit peak levels.
- Bear Case ($190): Revenue rises 20% in 2025, with an 11% CAGR and 54% gross margin, yielding a 5% gain if 2nm delays or weaker demand slow progress.
This $190-$263 range reflects TSMC’s edge in technology and production capacity, with significant upside potential from AI and HPC trends, offset by risks from CapEx and execution challenges. TSMC is well-positioned for growth, with the base case indicating a potential 20% return and the bull case offering greater upside if growth outperforms expectations.