[IN-DEPTH ANALYSIS] Bank of America: The Mighty Carrier Sailing Through 2025's Interest Rate and Regulatory Shifts


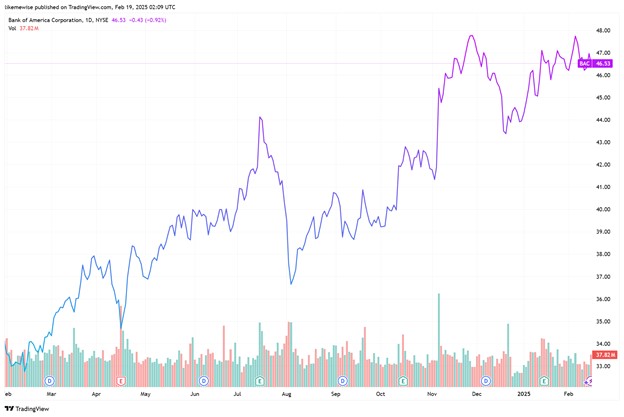
Source: TradingView
Key Points
- Bank of America has expanded via major M&As. Its four major segments have contributed significantly to making it the second-largest retail bank in the U.S..
- BofA's NIM is expected to bottom and then increase moderately in 2025.BofA has one of the top-tier credit asset qualities in the banking industry.Larger US banks like BofA are likely to benefit from the expected deregulatory environment in 2025.
- Overall, with a solid financial base, BofA is still a good choice for long-term investors. In the short term, considering that its valuation is at a relatively high percentile level , its stock performance won't be exciting, with a reasonable target price of around $45 - $55.
Overview
Bank of America (BAC.N), a titan in the global financial industry, has a storied history marked by strategic mergers and acquisitions. It has evolved through significant consolidations like the merger with NationsBank in 1998. Key acquisitions such as Merrill Lynch, U.S. Trust, Countrywide Financial, FleetBoston Financial, and LaSalle Bank have shaped its business landscape. These deals have both expanded its market reach and product offerings, and presented challenges, especially during the 2008 financial crisis. In 2024, it reported robust financials with total revenues of $96.07 billion and a net income after tax of $29.25 billion, and a market cap of $344.77 billion, underpinning its Global Systemic Importance. Structured into 4 main segments - Global Banking, Global Markets, Consumer Banking, and Global Wealth and Investment Management - the bank serves a diverse clientele.
- Consumer Banking:BofA is the second-largest retail bank in the U.S. by deposits, holding approximately 10-12% of the market share, trailing only JPMorgan Chase. In 2024, the segment generated approximately $42.7 billion in revenue, driven by strong growth in digital banking users and higher interest income amid rising interest rates.
- Global Banking: The segment’s profitability is closely tied to capital markets activity, with advisory and underwriting fees playing a significant role. Bank of America Merrill Lynch, the bank’s investment banking arm, is a key component of this segment. In 2024, the segment generated approximately $32.5 billion in revenue, with strong contributions from corporate lending and investment banking fees.
- Global Markets: This segment provides sales and trading services. BofA is a top-tier player in global markets, consistently ranking among the top three in fixed income trading and top five in equities trading. In 2024, the segment contributed approximately $20.8 billion in revenue, with fixed income trading accounting for the majority of the revenue.
- Global Wealth and Investment Management:This caters to affluent and high-net-worth individuals, offering wealth management, brokerage, banking, and trust services. This segment includes Merrill Lynch Wealth Management and Private Bank (formerly U.S. Trust), which provide tailored financial solutions and investment advice. BofA ranked among the top three U.S. wealth managers by assets under management (AUM), with over $1.5 trillion in AUM as of 2024.The segment contributed approximately $16.8 billion in revenue, with a pre-tax margin of around 30%, reflecting its high profitability.
Chart BofA’s Quarterly Revenue by Segments
Period Ending | 31-Dec-24 | 30-Sep-24 | 30-Jun-24 | 31-Mar-24 | 31-Dec-23 | 30-Sep-23 |
Consumer Banking | 10.76B | 10.71B | 10.88B | 11.14B | 11.59B | 12.40B |
Consumer Banking Growth | -7.19% | -13.68% | -13.70% | -11.90% | -7.37% | 2.81% |
Global Banking | 8.14B | 8.47B | 9.14B | 9.68B | 10.25B | 10.32B |
Global Banking Growth | -20.61% | -17.90% | -6.56% | 12.05% | 31.27% | 30.02% |
Global Markets | 5.69B | 5.38B | 5.08B | 4.78B | 4.68B | 4.55B |
Global Markets Growth | 21.59% | 18.41% | 16.50% | 11.77% | 11.86% | 4.58% |
Global Wealth and Investment Management | 4.26B | 4.11B | 4.08B | 4.04B | 3.95B | 4.13B |
Global Wealth and Investment Management Growth | 8.01% | -0.41% | -4.71% | -9.49% | -15.57% | -12.19% |
Source: TradingKey, SEC Filings
Outlook in 2025: Decrease in Uncertainties and Resilience of Profitability
In 2025, BofA faces a complex business landscape amidst the uncertainties of the economic cycle and the financial environment. With the interest rate cutting cycle underway, the macroeconomy is evolving towards a "soft landing" scenario. This complex yet promising poses challenges and opportunities for BofA.
1) NIM of BofA is likely to bottom out modestly in 2025. On one hand, as the Fed is expected to cut interest rates 3-4 times in 2025, which might lead to a recovery in mortgages, and the cost of deposits remains average percentile. As of Q4 2024, BofA reported a NIM of approximately 1.97%, reflecting its higher loan yields and a favorable deposit mix. In 2025, we project a NIM range of 2.20%-2.30% with a increase of 20 bps from 2024. The stabilization and expansion of NIM is likely to be a significant catalyst for profit expansion, allowing Bank of America to better navigate interest rate - related challenges and capitalize on its strengths to achieve growth in the coming period.
.jpg)
Source: Refinitiv
Despite these headwinds, BofA's strong deposit franchise, with over $1.96 trillion in deposits as of 2024, and its focus on low-cost funding sources will help mitigate the impact. Moreover, the proportion of non - interest income in average assets reaches highest level(1.4%, 10bp increased) in 2024, driven by the rise in asset prices and the upswing in investment banking activities. Furthermore, the bank's ongoing digital transformation and efficiency initiatives, along with diversified revenue streams and prudent balance sheet management, will support its profitability .
2) The Decline in NCOs rate enhanced BofA’s credit quality. In 2024 Q4, the non-performing loan rate of Bank of America drops 1 bp QoQ to 0.78%, and the slowdown in NCOs rate brings a significant positive signal. In addition, the coverage ratio of loan loss reserves has been maintained at a reasonable range(150%), which provides a strong guarantee for the quality of credit assets.
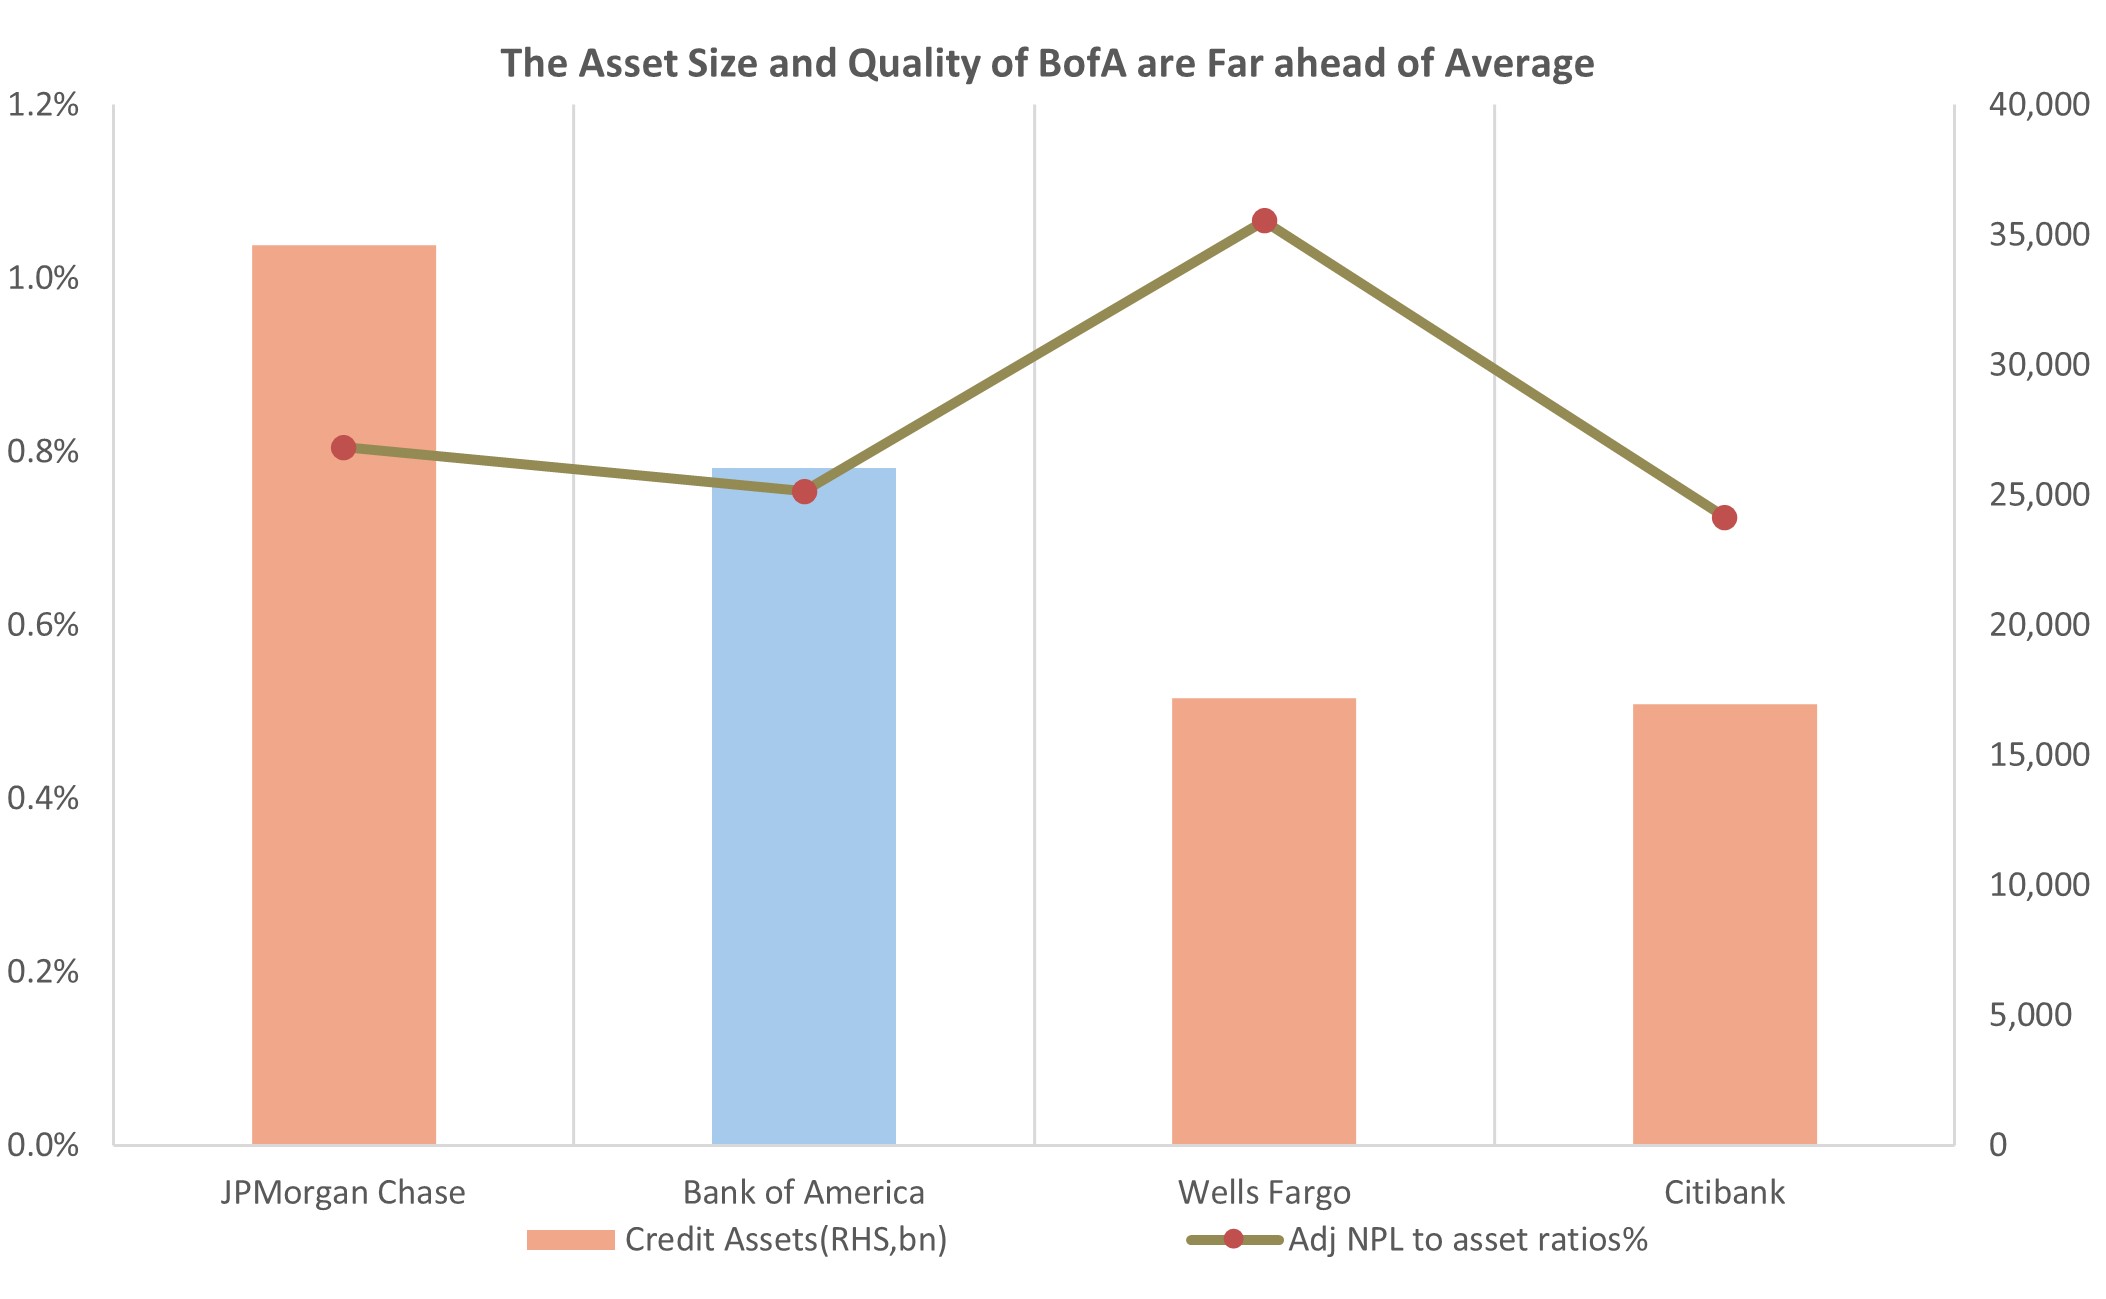
Source: Refinitiv
BofA is one of the top-tier credit asset qualities in the industry. For example, Wells Fargo also faced challenges, with its overall non - performing loan rate increasing by 4 bp to 1.07% due to troubled loans in sectors like consumer lending. While other large banks struggled with significant increases in commercial real estate NPLs, BofA managed credit risks well through a diversified loan portfolio and a conservative lending approach.
3) Rgulatory policies are reshaping the US banking. With the Republican administration in control, there is likely to be a focus on deregulatory efforts, including the effective shutdown of the Consumer Financial Protection Bureau (CFPB), a shift towards deregulation in the cryptocurrency sector, and weaker Basel Endgame and reduced capital surcharge. Balancing operational costs and maintaining flexibility will be crucial for banks to navigate the evolving regulatory landscape.
With the expected general deregulatory environment, larger US banks are likely to benefit positively. A lower capital requirement could allow them to increase lending by 15 - 20% based on historical data, boosting interest income. On the other hand, small banks, with an average asset size of around $500 million in 2024, who are more sensitive to local economic fluctuations, and the Basel Endgame rollback is less relevant to them. Instead, they may face increased competition from large banks, and sector consolidation is expected to accelerate.
Bank | Minimum CET1 Capital Ratio | Stress Capital Buffer (SCB) | G-SIB Surcharge | Total CET1 Requirement |
Bank of America | 4.50% | 2.50% | 1.00% | 8.00% |
JPMorgan Chase | 4.50% | 3.00% | 2.00% | 9.50% |
Citigroup | 4.50% | 2.50% | 1.50% | 8.50% |
Wells Fargo | 4.50% | 2.50% | 1.00% | 8.00% |
Goldman Sachs | 4.50% | 3.50% | 1.50% | 9.50% |
Morgan Stanley | 4.50% | 3.00% | 1.50% | 9.00% |
US Bancorp | 4.50% | 2.50% | 0.00% | 7.00% |
PNC Bank | 4.50% | 2.50% | 0.00% | 7.00% |
Truist Bank | 4.50% | 2.50% | 0.00% | 7.00% |
KeyBank | 4.50% | 2.50% | 0.00% | 7.00% |
Huntington National Bank | 4.50% | 2.50% | 0.00% | 7.00% |
Source: Federal Reserve
Financials and Valuation
Looking ahead to 2025, BofA’s NII is expected to reach a record high, with an robust earnings growth of around 7%, driven by factors such as stable net interest income, digital banking advancements, and expansion in wealth management and lending. Overall, with a solid financial base and a proactive development strategy, BAC is a good choice for long-term investors. However, considering its valuation is at a high percentile level, its shares performance won't be exciting in the short term. The reasonable target price of BAC is around $45 - $55.
Bank | P/E Ratio | P/B Ratio | Dividend Yield | ROE (%) | EPS Growth (2024) | Revenue Growth (2024) |
JPMorgan Chase | 11.5x | 1.5x | 2.90% | 15% | 8% | 6% |
Bank of America | 10.5x | 1.2x | 2.80% | 11.50% | 7% | 5% |
Wells Fargo | 12.0x | 1.1x | 3.00% | 10% | 6% | 4% |
Goldman Sachs | 13.0x | 1.3x | 2.50% | 12% | 10% | 8% |
Morgan Stanley | 14.0x | 1.4x | 3.20% | 13% | 9% | 7% |
U.S. Bancorp | 11.0x | 1.6x | 4.50% | 14% | 4% | 3% |
Truist Financial | 9.5x | 1.0x | 5.00% | 8% | 3% | 2% |
PNC Financial | 10.0x | 1.2x | 4.20% | 10% | 5% | 4% |
Capital One | 7.5x | 0.9x | 2.00% | 11% | 12% | 10% |
Mean | 11.17x | 1.27x | 3.29% | 11.61% | 7.22% | 5.44% |
Source: TradingKey