[IN-DEPTH ANALYSIS] US: Will the USD Index Decline Irreversibly from Today Onward?


Executive Summary
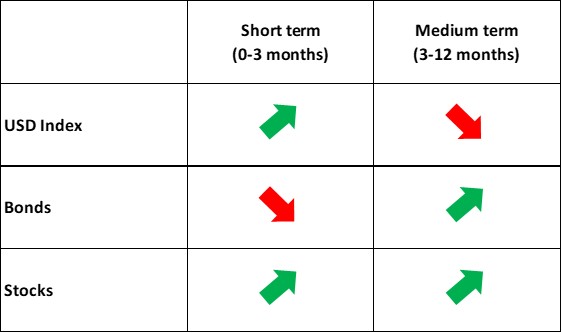
In the short term (0-3 months), the US dollar's trajectory will be driven by three key themes: concerns over reflation, a widening policy rate gap between the Fed and other major central banks and the dollar’s safe-haven appeal coming to the forefront. All three factors point to an upward trend for the USD Index. However, in the medium term (3-12 months), the resumption of Fed rate cuts is expected to mark the USD index’s peak and subsequent decline.
* Investors can directly or indirectly invest in the foreign exchange market, bond market and stock market through passive funds (such as ETFs), active funds, financial derivatives (like futures, options, and swaps), CFDs and spread betting.
1. Macroeconomics
From the mid-1970s to the early 1980s, the US experienced stagflation—a period of low growth (or recession) combined with high inflation—triggered by the oil crisis. GDP recorded negative growth in 1974, 1975, 1980 and 1982, while CPI reached double digits in 1974 and again from 1979 to 1981 (Figure 1.1). Many pessimistic economists now predict that 2025 will bring a sharp rise in US inflation alongside significantly slower growth, potentially ushering in another stagflationary period.
We disagree with this view. Recent pessimism stems largely from weaker-than-expected Q4 GDP data. While Q4 GDP grew at an annualized rate of 2.3%—below the consensus of 2.6% (Figure 1.2)—a breakdown of the growth structure reveals resilient consumption. Consumer spending rose at an annualized rate of 4.2%, well above the prior quarter’s 3.7%, providing a strong inertial boost to overall economic growth.
High-frequency data further underscores the US economy’s resilience. January retail sales grew 4.2% year-on-year, up from 3.9% previously. Industrial production, after three consecutive months of decline, turned positive from December 2024. The Manufacturing PMI has expanded for four straight months. While the February Services PMI dipped below the 50 threshold, it had remained in expansionary territory for the prior 12 months. Given robust consumption, the Services PMI is likely to rebound in the short and medium term.
US inflation has been rebounding since bottoming out in September 2024. January 2025 headline and core CPI rose 3.0% and 3.3% year-on-year, respectively, both exceeding expectations. This has led pessimists to argue that a second wave of inflation has arrived, exacerbated by Trump’s high-tariff policies, which they believe will sustain elevated inflation—another key pillar of their 2025 stagflation forecast.
As with growth, we diverge from their inflation outlook. During Trump’s first term (Trump 1.0), despite widespread expectations that his tariff policies would drive inflation higher, neither headline nor core CPI saw significant increases (Figure 1.3). In Trump 2.0, we anticipate his energy policies will partially offset the inflationary impact of tariffs, leading to lower-than-expected inflation and creating room for larger Fed rate cuts. More specifically, while markets currently price in 2 Fed rate cuts by the end of 2025, we project 3-4 cuts.
Figure 1.1: US GDP growth and CPI during 1970 and 1985 (%)
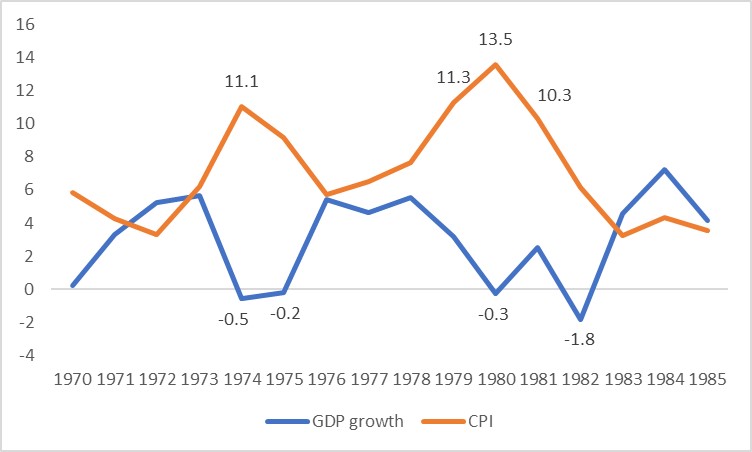
Source: World Bank, Tradingkey.com
Figure 1.2: GDP growth (annualized, %)
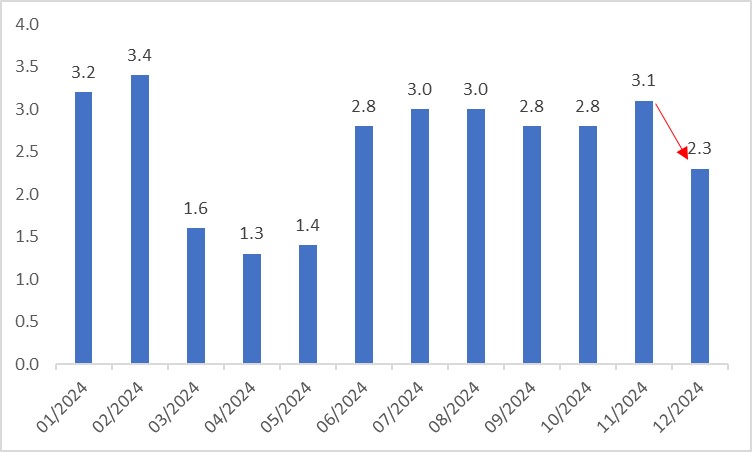
Source: Refinitiv, Tradingkey.com
Figure 1.3: US inflation (%) during Trump 1.0

Source: Refinitiv, Tradingkey.com
2. Exchange Rate (USD Index)
In the first three quarters of 2024, the USD Index traded within a range. However, starting in Q4, Trump’s rising election odds and eventual victory fuelled the “Trump Trade”, propelling the dollar higher. After his January inauguration, fears that his tariff hikes would stoke inflation intensified the “Trump Trade”, pushing the USD Index to a peak of 109.6 on 10 January. Since February, Trump’s shifting tariff stance toward Canada and Mexico has temporarily eased high-tariff concerns, leading to a modest dollar pullback (Figure 2.1).
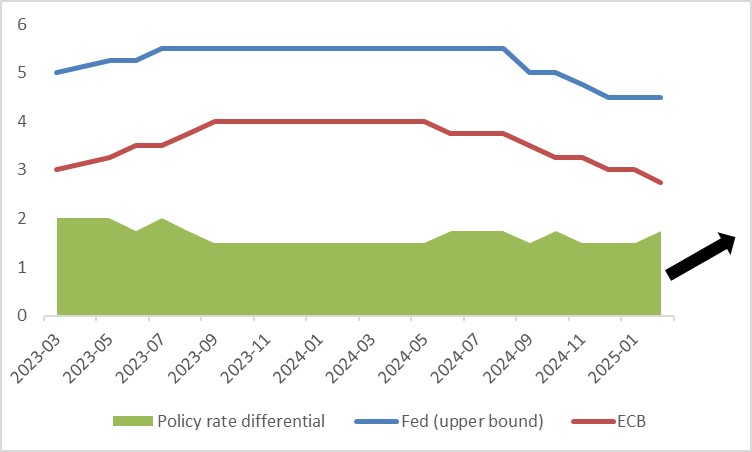
Looking ahead, in the short term (0-3 months), three drivers will shape the dollar’s path. First, reflation concerns—evidenced by recent inflation’s rebound—have prompted the Fed to pause rate cuts, shifting its already slower-than-expected easing pace to a more hawkish stance. This will likely lift the dollar index. Second, most major central banks (excluding the Bank of Japan) have entered rate-cutting cycles, with cuts outpacing the Fed’s, widening the policy rate differential and attracting capital to the US (Figure 2.2). Third, despite uncertainties in Trump’s policies, we see higher tariffs on key trading partners as a prevailing trend, slowing global growth and reinforcing the dollar’s safe-haven status.
While our base scenario is a short-term rise in the USD Index, downside risks remain. Recent softening in Ukraine’s stance on NATO membership and territorial recovery could, with US pressure, lead to a Russia-Ukraine ceasefire. An end to the war would lower energy prices, reduce geopolitical risks and boost confidence in Europe’s economy, supporting the euro—the largest component of the USD Index—and pressuring the dollar lower.
In the medium term (3-12 months), as mentioned above, we expect larger-than-anticipated Fed rate cuts, which will drive the dollar to peak and then retreat.
Figure 2.1: USD Index
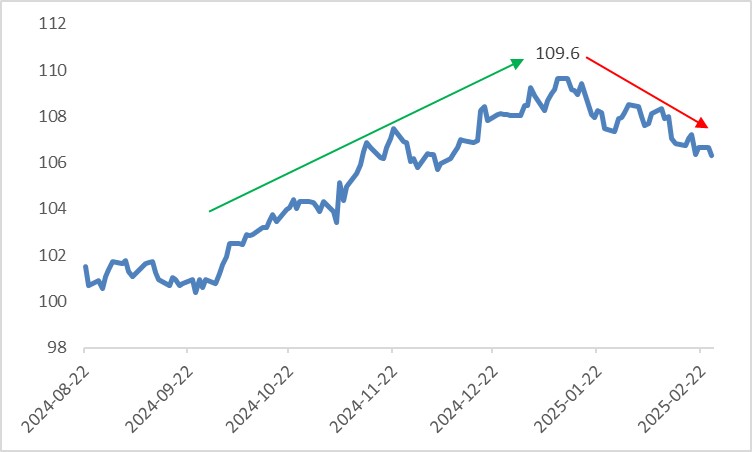
Source: Refinitiv, Tradingkey.com
Figure 2.2: Fed vs. ECB policy rate (%)
Source: Refinitiv, Tradingkey.com
3. Bonds
Rising inflation, persistent hawkish sentiment and the Fed’s pause on rate cuts are providing short-term support for US Treasury yields. However, in the medium term, shifts in inflation expectations and the resumption of Fed cuts will mark a turning point for yields. Additionally, Trump’s efforts to lower energy prices and curb federal deficits will further depress yields.
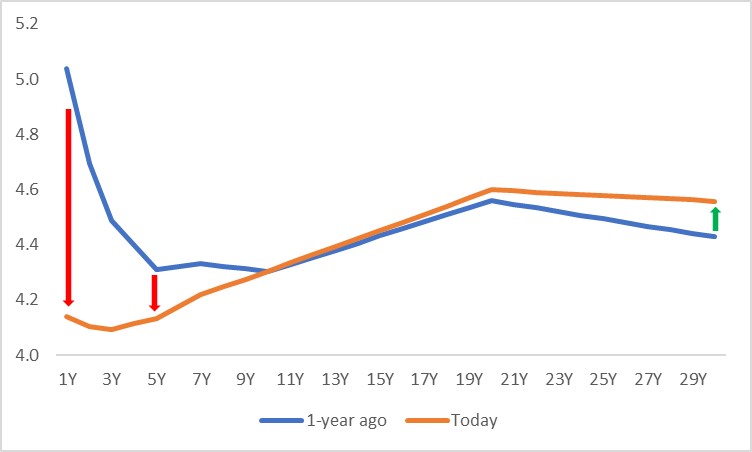
Regarding duration, larger-than-expected Fed cuts in 3-12 months will be the primary driver of a downward shift in the yield curve. Short-term (front-end) yields, more sensitive to policy rates, are likely to fall more sharply than long-term (back-end) yields (Figure 3.1).
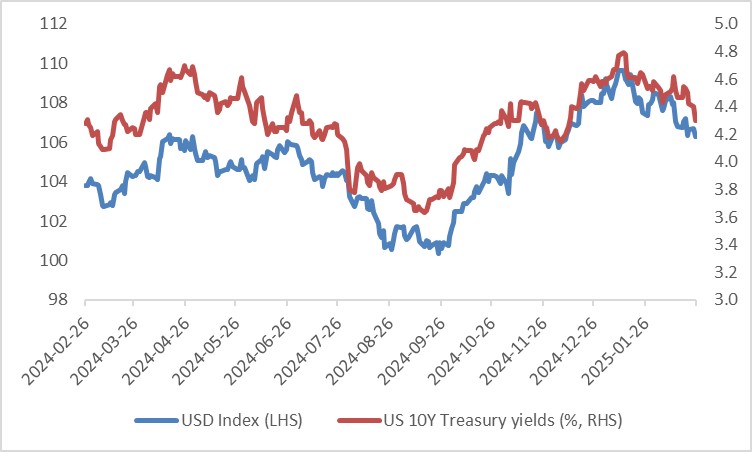
Historically, Treasury yields and the USD Index exhibit a strong positive correlation. An initial rise followed by a decline in yields could mirror a similar pattern in the dollar (Figure 3.2).
Figure 3.1: US Treasury yield curve (%)
Source: Refinitiv, Tradingkey.com
Figure 3.2: US 10Y Treasury yields vs. USD Index
Source: Refinitiv, Tradingkey.com
4. Stocks
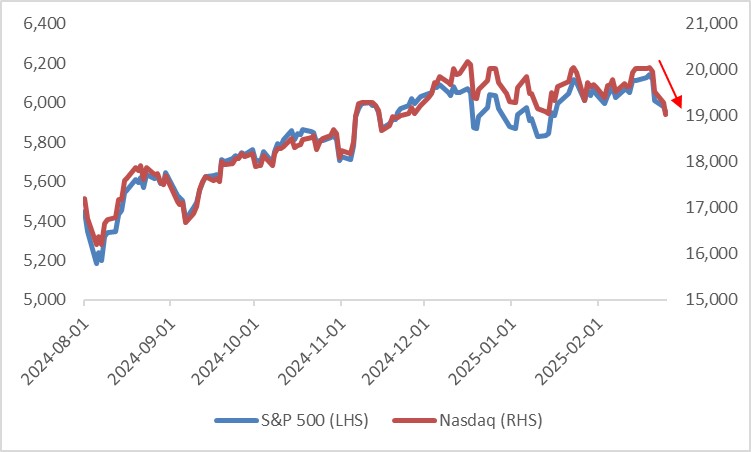
Recent weakness in Q4 GDP growth, a Services PMI drop below 50 and uncertainties surrounding Trump’s policies have weighed on US tech giants, dragging the S&P 500 and Nasdaq sharply lower from mid-February highs (Figure 4).
Looking forward, we remain bullish on US equities for three reasons. First, Trump’s potential domestic tax cuts will boost corporate after-tax profits and encourage investment. Second, this rate-cutting cycle is characterized as preventive rather than relief-driven. Since 1995, three of six cutting cycles were preventive (Jul 1995-Jan 1996, Sep 1998-Nov 1998 and Jul 2019-Oct 2019) and US stocks rose in each. This cycle is likely to lift equities as well. Third, with around 80% of companies beating earnings expectations and the US economy showing resilience, corporate profit growth should persist.
Figure 4: US stocks
Source: Refinitiv, Tradingkey.com


.jpg)